Fig. 8.
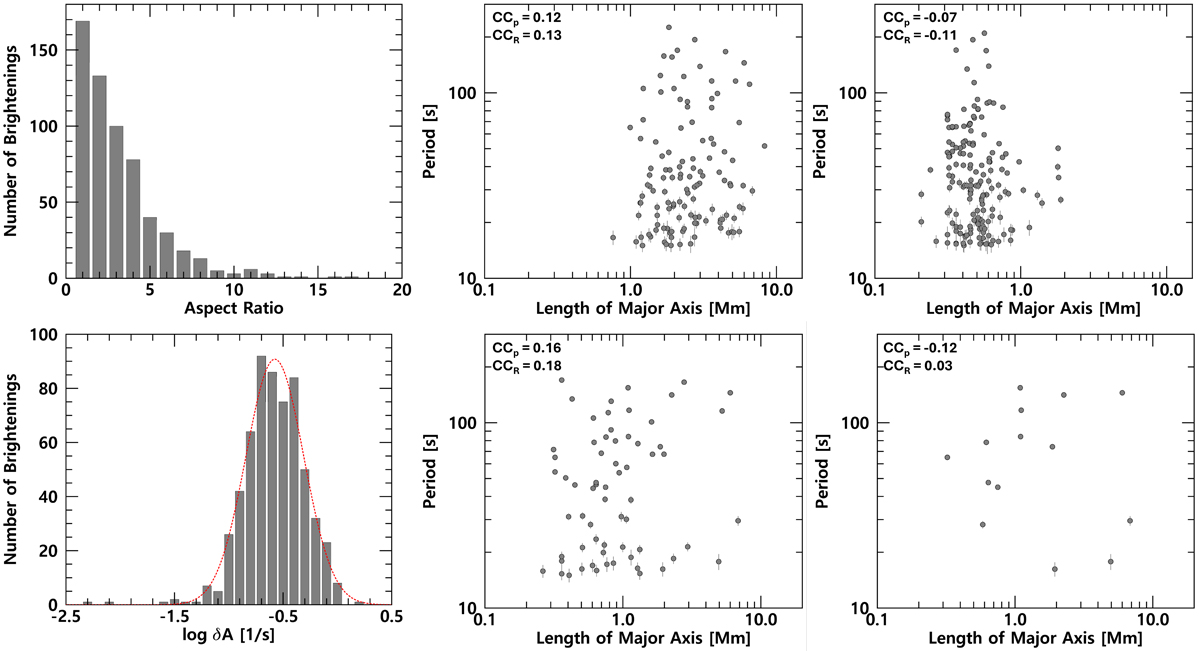
Download original image
Center and right panels: Scatter plots of the QPP period versus EUV brightening major axis length scales as a function of the aspect ratio (top) and the rate of area change, δA (bottom). Left panels: Histograms of the aspect ratio and log δA. In the histogram of log δA, the dashed red line indicates the fitted normal distribution with the mean (μ=−0.58) and the standard deviation (σ=0.27). For the aspect ratio, scatter plots are shown for events with values greater than 5 (top centre) and less than 2 (top right). Similarly, for the rate of area change, scatter plots are presented for events with values smaller than μ−σ (bottom centre) and smaller than μ−2σ (bottom right). The CCP and CCR are indicated.
Current usage metrics show cumulative count of Article Views (full-text article views including HTML views, PDF and ePub downloads, according to the available data) and Abstracts Views on Vision4Press platform.
Data correspond to usage on the plateform after 2015. The current usage metrics is available 48-96 hours after online publication and is updated daily on week days.
Initial download of the metrics may take a while.