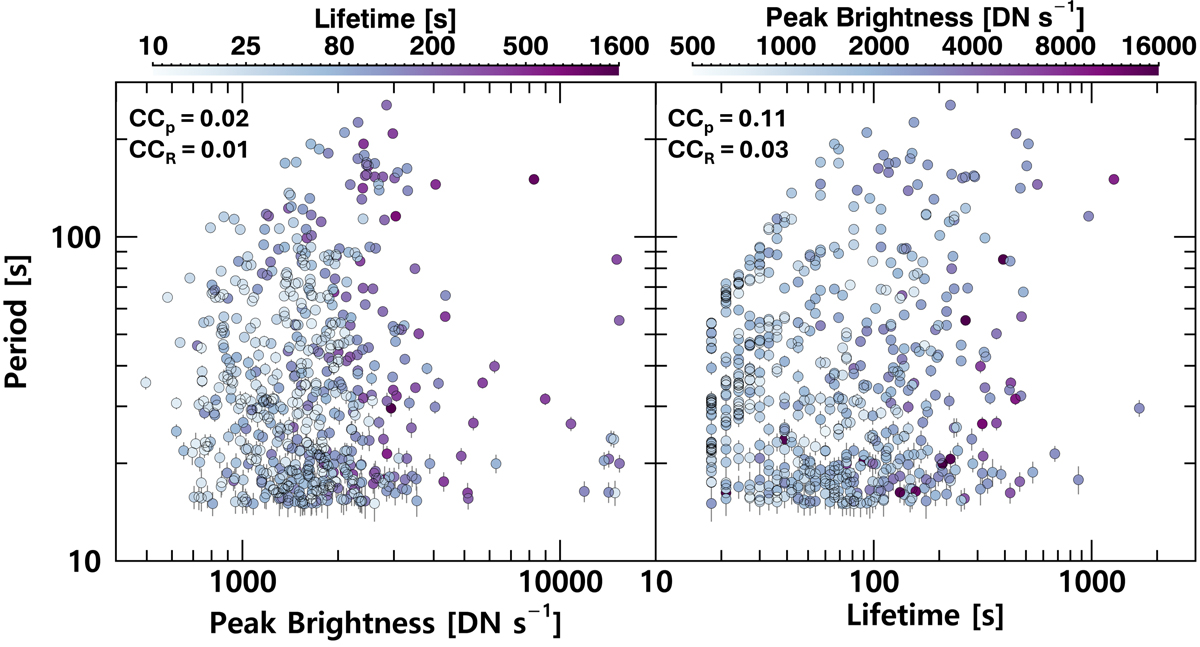
Fig. 6.
Download original image
Scatter plots of the QPP period versus the peak brightness (left panel) and lifetime (right panel) of EUV brightenings. Period uncertainties were estimated from the frequency width of the Gaussian bump in Model S1 to the power spectrum. The colour scales in each panel represent the logarithmic values of lifetime and peak brightness. The CCP and CCR are indicated.
Current usage metrics show cumulative count of Article Views (full-text article views including HTML views, PDF and ePub downloads, according to the available data) and Abstracts Views on Vision4Press platform.
Data correspond to usage on the plateform after 2015. The current usage metrics is available 48-96 hours after online publication and is updated daily on week days.
Initial download of the metrics may take a while.