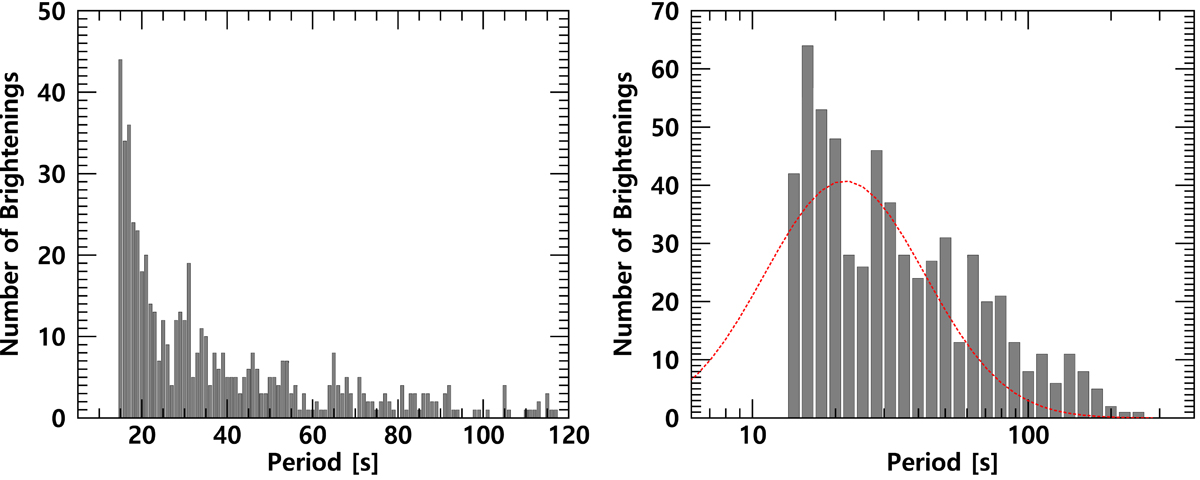
Fig. 5.
Download original image
Histograms of the periods of detected QPPs. Left panel: Histogram showing periods of up to 120 s. Right panel: Logarithmic histogram showing the full range of periods. Note that periods below 15 s are excluded, as we applied a conservative criterion requiring detected periods to be at least five times the observational cadence of 3 s. The dashed red line represents the normal distribution in log space, with a mean of 21.6 s of QPP periods observed in standard solar flares (Hayes et al. 2020).
Current usage metrics show cumulative count of Article Views (full-text article views including HTML views, PDF and ePub downloads, according to the available data) and Abstracts Views on Vision4Press platform.
Data correspond to usage on the plateform after 2015. The current usage metrics is available 48-96 hours after online publication and is updated daily on week days.
Initial download of the metrics may take a while.