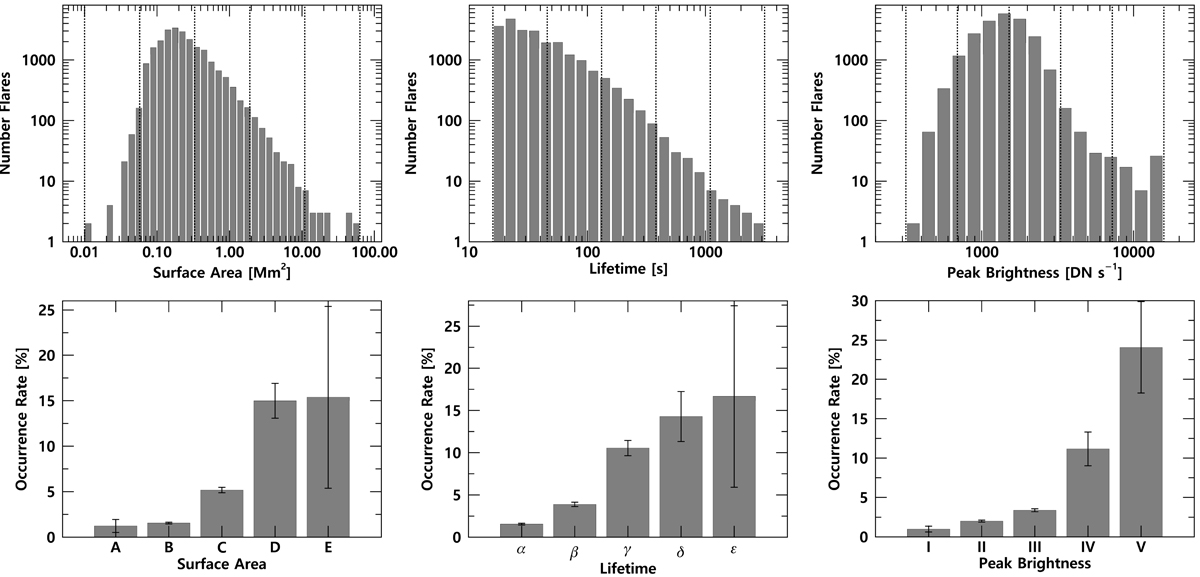
Fig. 4.
Download original image
Histograms of the surface area, lifetime, and peak brightness of EUV brightenings (top) and the occurrence rates of QPPs as a function of these three parameters (bottom). A value of 1 was added as an offset to handle bins with a count of 1 in the logarithmic scale histogram. The dashed lines in the histograms indicate the threshold values used to divide the sample into five subgroups. The error bars for the occurrence rates, reflecting the varying bin populations, were calculated based on Poisson statistics.
Current usage metrics show cumulative count of Article Views (full-text article views including HTML views, PDF and ePub downloads, according to the available data) and Abstracts Views on Vision4Press platform.
Data correspond to usage on the plateform after 2015. The current usage metrics is available 48-96 hours after online publication and is updated daily on week days.
Initial download of the metrics may take a while.