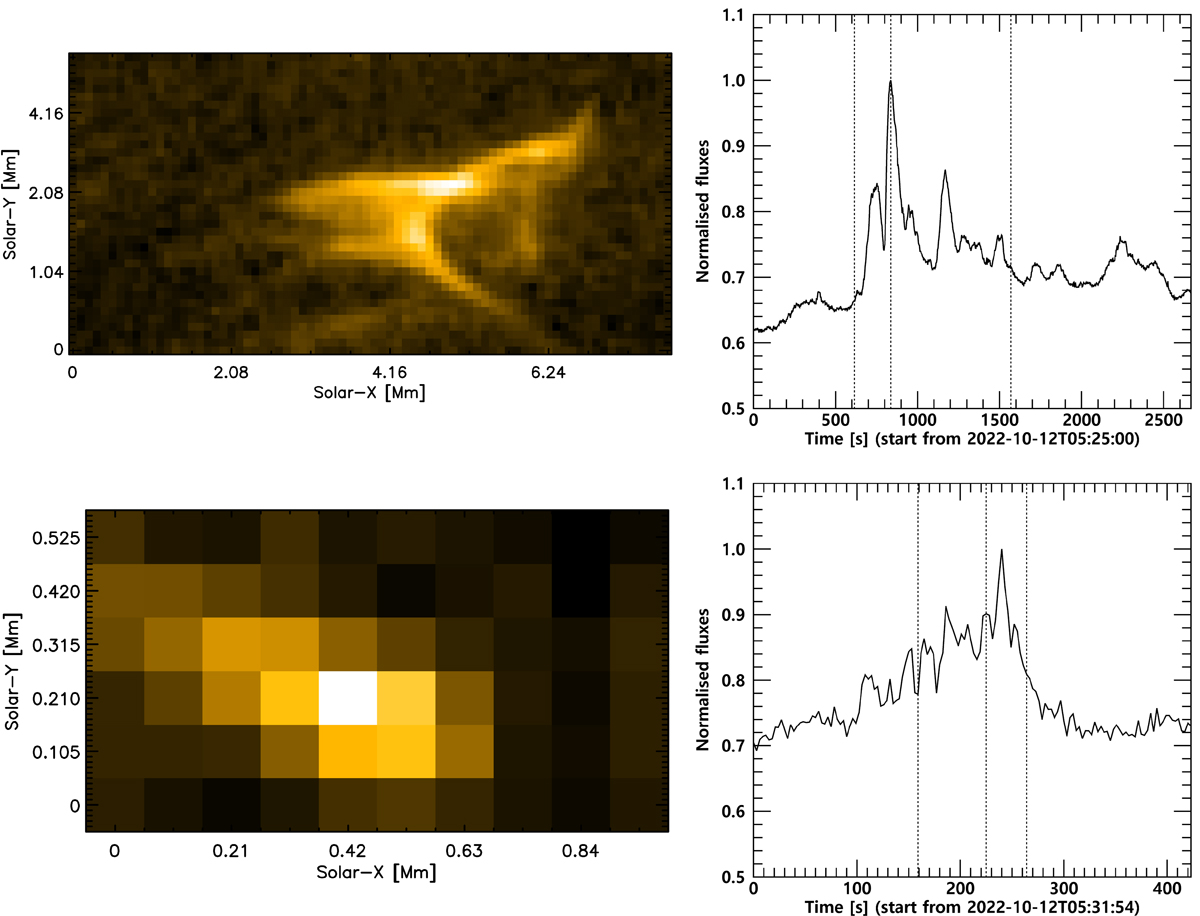
Fig. 2.
Download original image
Examples of EUV brightenings detected with HRIEUV (left) alongside their corresponding light curves (right), showing the normalised integrated brightness over the entire brightening regions observed on 12 October 2022. Dashed lines indicate the start, peak, and end times of each EUV brightening. Each brightening image corresponds to its peak time. Animations for both EUV brightening events in this figure are available.
Current usage metrics show cumulative count of Article Views (full-text article views including HTML views, PDF and ePub downloads, according to the available data) and Abstracts Views on Vision4Press platform.
Data correspond to usage on the plateform after 2015. The current usage metrics is available 48-96 hours after online publication and is updated daily on week days.
Initial download of the metrics may take a while.