Open Access
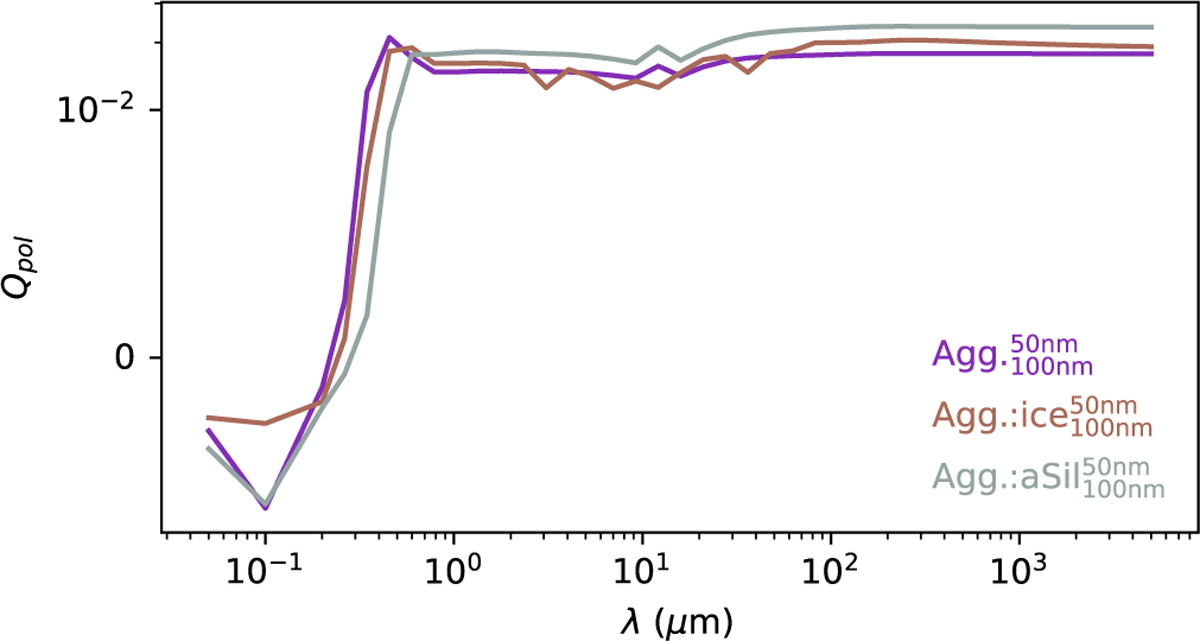
Fig. C.3
Download original image
Polarisation efficiency for the 3 types of grains. The y-axis scale is sym-log, meaning that values between −10−2 and 10−2 are plotted on a linear scale to allow the 0 crossing, and the remaining of the axis is in log scale.
Current usage metrics show cumulative count of Article Views (full-text article views including HTML views, PDF and ePub downloads, according to the available data) and Abstracts Views on Vision4Press platform.
Data correspond to usage on the plateform after 2015. The current usage metrics is available 48-96 hours after online publication and is updated daily on week days.
Initial download of the metrics may take a while.