Fig. 3
Download original image
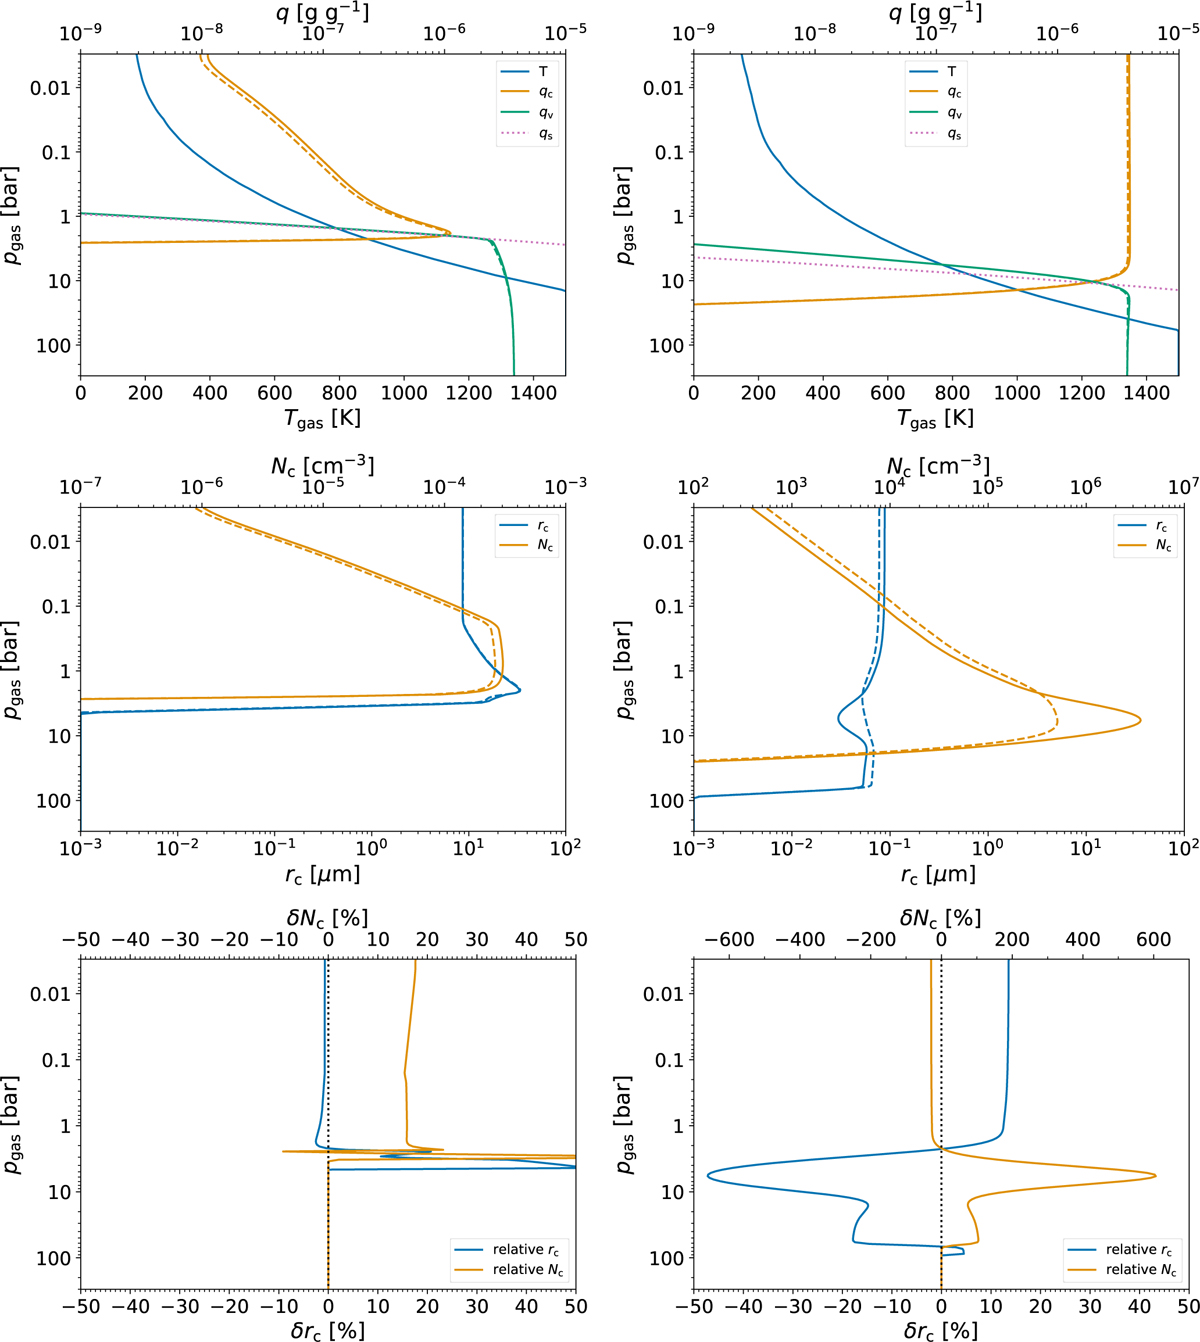
KCl cloud structures using the log g = 3.25 (left) and log g = 4.25 (right) Y-dwarf temperature-pressure profiles from Gao et al. (2018) and assuming a constant Kzz = 108 cm2 s−1. The dashed lines show the monodisperse size distribution and the solid lines the exponential size distribution results. The top panel shows the temperature-pressure profiles with the mass mixing ratio of the condensate, qc, vapour, qv, and saturation point, qs. The middle panel shows the mean particle size, rc, and total number density, Nc. The bottom panel shows the relative difference in rc and Nc between the monodisperse and exponential cloud structure.
Current usage metrics show cumulative count of Article Views (full-text article views including HTML views, PDF and ePub downloads, according to the available data) and Abstracts Views on Vision4Press platform.
Data correspond to usage on the plateform after 2015. The current usage metrics is available 48-96 hours after online publication and is updated daily on week days.
Initial download of the metrics may take a while.