Open Access
Fig. 2
Download original image
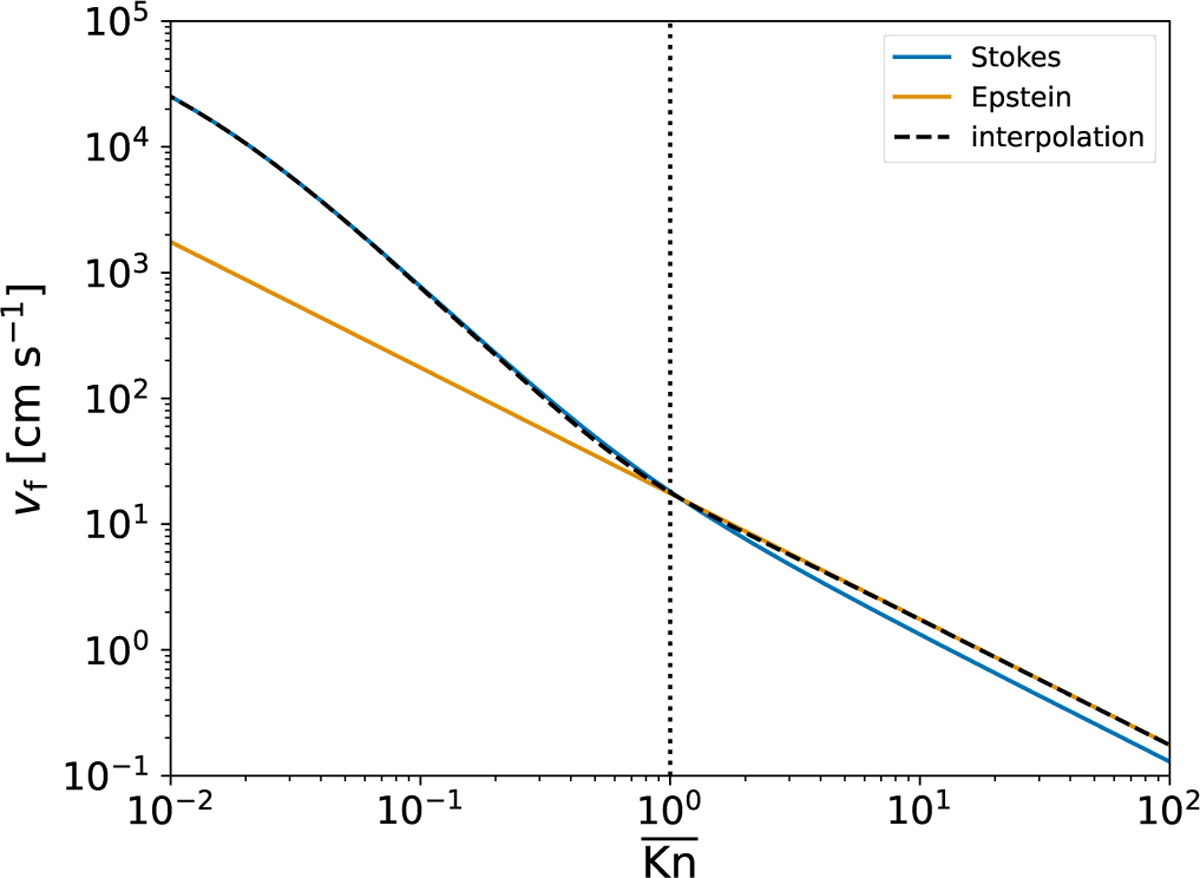
Example of the settling velocity tanh smooth interpolation scheme. The blue line shows the Stokes law values (Eq. (92)), the orange line the Epstein law values (Eq. (93)), and the dashed black line the interpolation function (Eq. (94)). The background gas is assumed to be T = 500 K, p = 10−3 bar, ![]() , and 100% H2.
, and 100% H2.
Current usage metrics show cumulative count of Article Views (full-text article views including HTML views, PDF and ePub downloads, according to the available data) and Abstracts Views on Vision4Press platform.
Data correspond to usage on the plateform after 2015. The current usage metrics is available 48-96 hours after online publication and is updated daily on week days.
Initial download of the metrics may take a while.