Fig. 3
Download original image
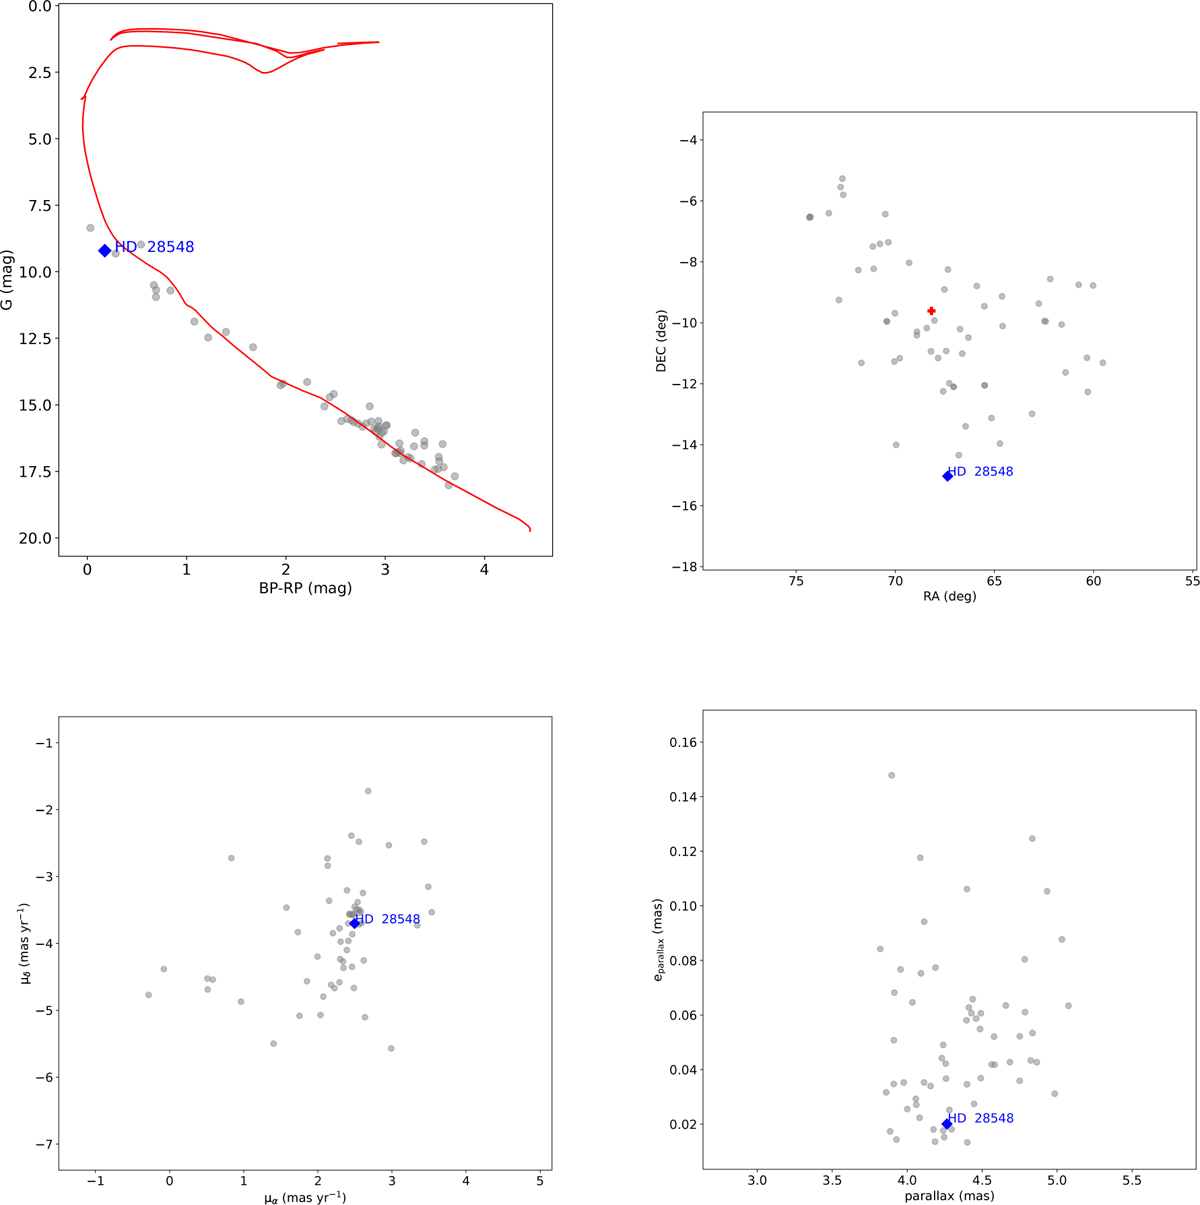
Distribution of probable members of the cluster HSC 1640 (gray circles) in different spaces, including the color–magnitude diagram (upper left), position (upper right), proper motion (lower left), and parallax space (lower right). The position of the λ Boo stars is indicated in the plots (blue diamonds). The cluster center is marked in the coordinate space (red plus signs). The best isochrone fit is shown with a red continuous line in the color–magnitude diagram (upper left).
Current usage metrics show cumulative count of Article Views (full-text article views including HTML views, PDF and ePub downloads, according to the available data) and Abstracts Views on Vision4Press platform.
Data correspond to usage on the plateform after 2015. The current usage metrics is available 48-96 hours after online publication and is updated daily on week days.
Initial download of the metrics may take a while.