Fig. A.1.
Download original image
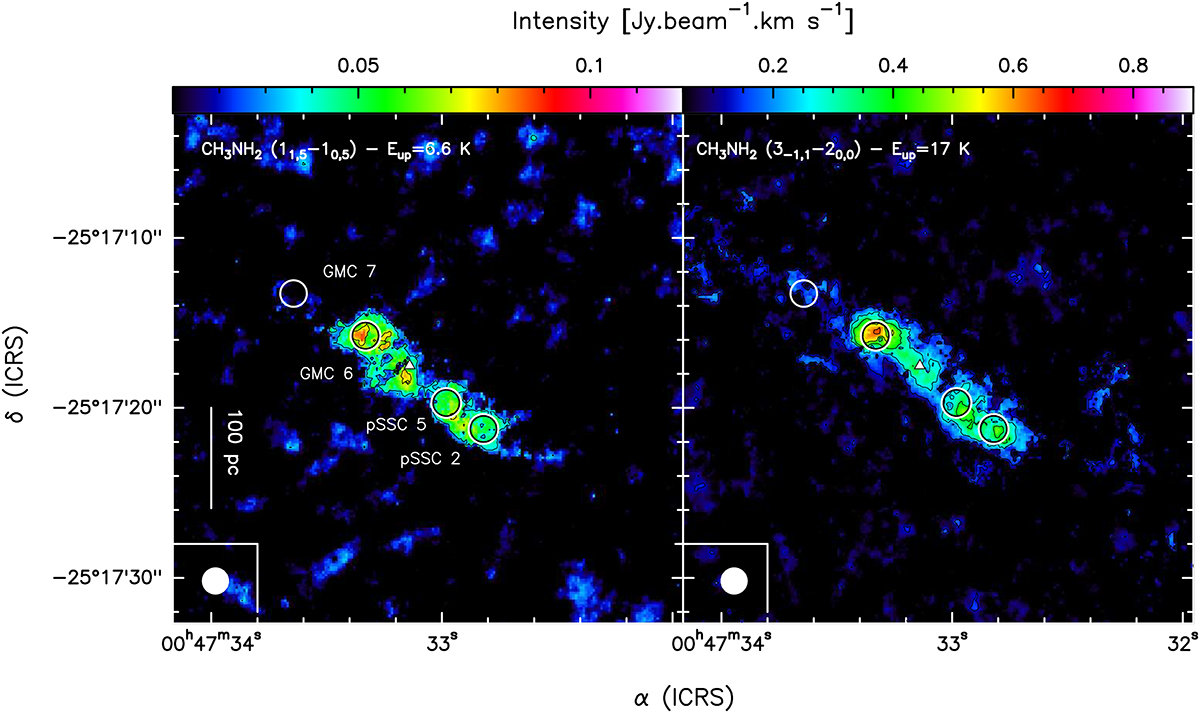
Velocity-integrated images of CH3NH2. The kinematic centre (Müller-Sánchez et al. 2010) is labelled by a white triangle. The regions where the spectra were extracted are shown by the black and white circles and are labelled in the left-most panel. The beam is depicted in the lower left corner of each plot. The scale bar of 100 pc corresponds to ∼6″. Left: Velocity-integrated map of CH3NH2 (11,5−10,5). Levels start at 3σ (1σ = 42 mJy beam−1 km s−1) with steps of 3σ. Right: Velocity-integrated map of CH3NH2 (3−1,1−20,0). Levels start at 3σ (1σ = 42 mJy beam−1 km s−1) with steps of 3σ.
Current usage metrics show cumulative count of Article Views (full-text article views including HTML views, PDF and ePub downloads, according to the available data) and Abstracts Views on Vision4Press platform.
Data correspond to usage on the plateform after 2015. The current usage metrics is available 48-96 hours after online publication and is updated daily on week days.
Initial download of the metrics may take a while.