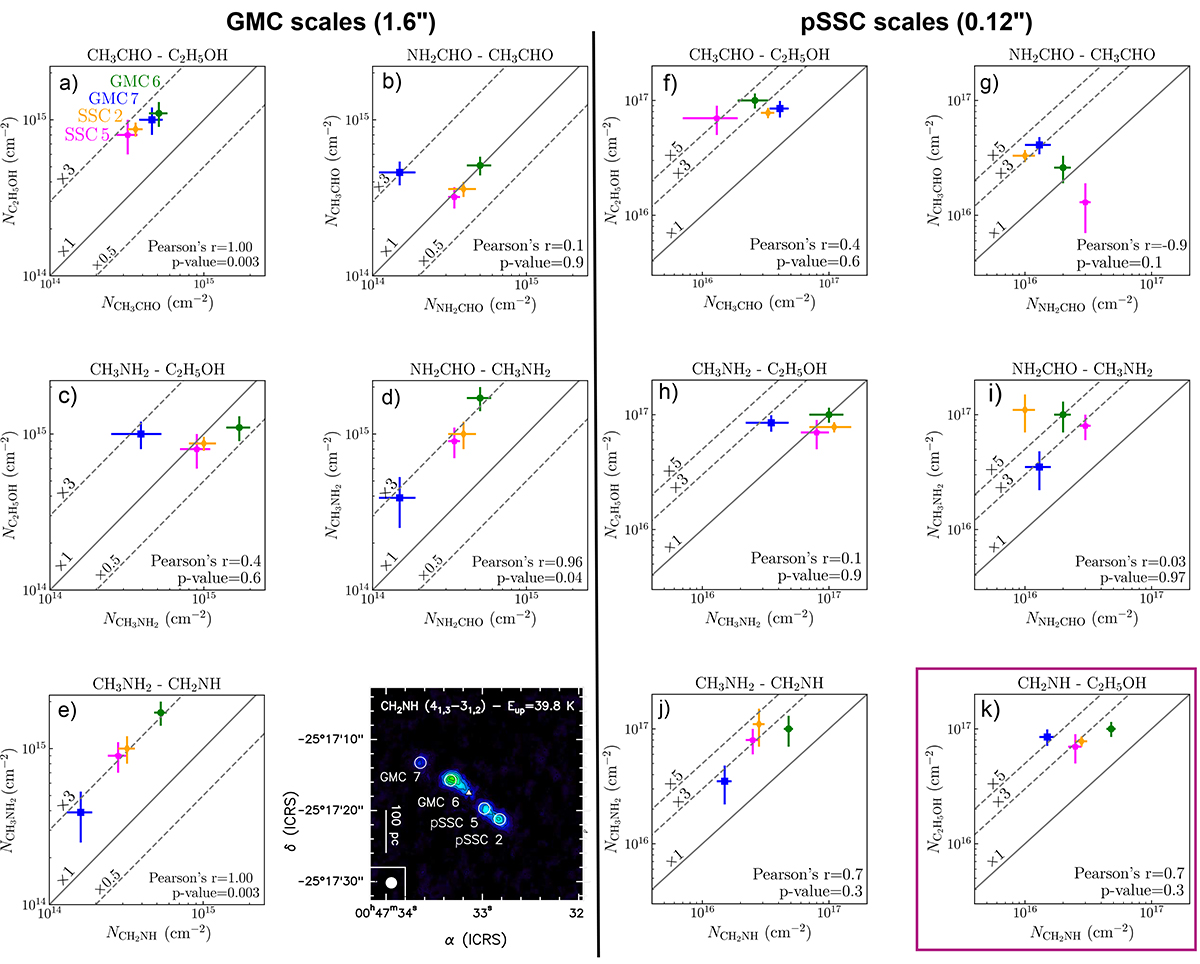
Fig. 6.
Download original image
Relation between the column densities of the iCOMs derived from the rotational diagrams at GMC scales (θ = 1.6″; left-hand side of the figure) and at pSSC scales (θ = 0.12″; right-hand side of the figure), for each region (GMC 7: blue; GMC 6: green; pSSC 5: magenta; pSSC 2: orange). Pearson's coefficient and p-values are indicated in the bottom right part of each plot. Dashed and full grey lines indicate abundance ratio factors. Panel k is highlighted as the correlation between CH2NH and C2H5OH is the same at both GMC-scale and pSSC-scale. For reference for the location of each region, we added a map of the CH2NH (41,3−31,2) transition in the bottom-left part of the figure.
Current usage metrics show cumulative count of Article Views (full-text article views including HTML views, PDF and ePub downloads, according to the available data) and Abstracts Views on Vision4Press platform.
Data correspond to usage on the plateform after 2015. The current usage metrics is available 48-96 hours after online publication and is updated daily on week days.
Initial download of the metrics may take a while.