Fig. 5.
Download original image
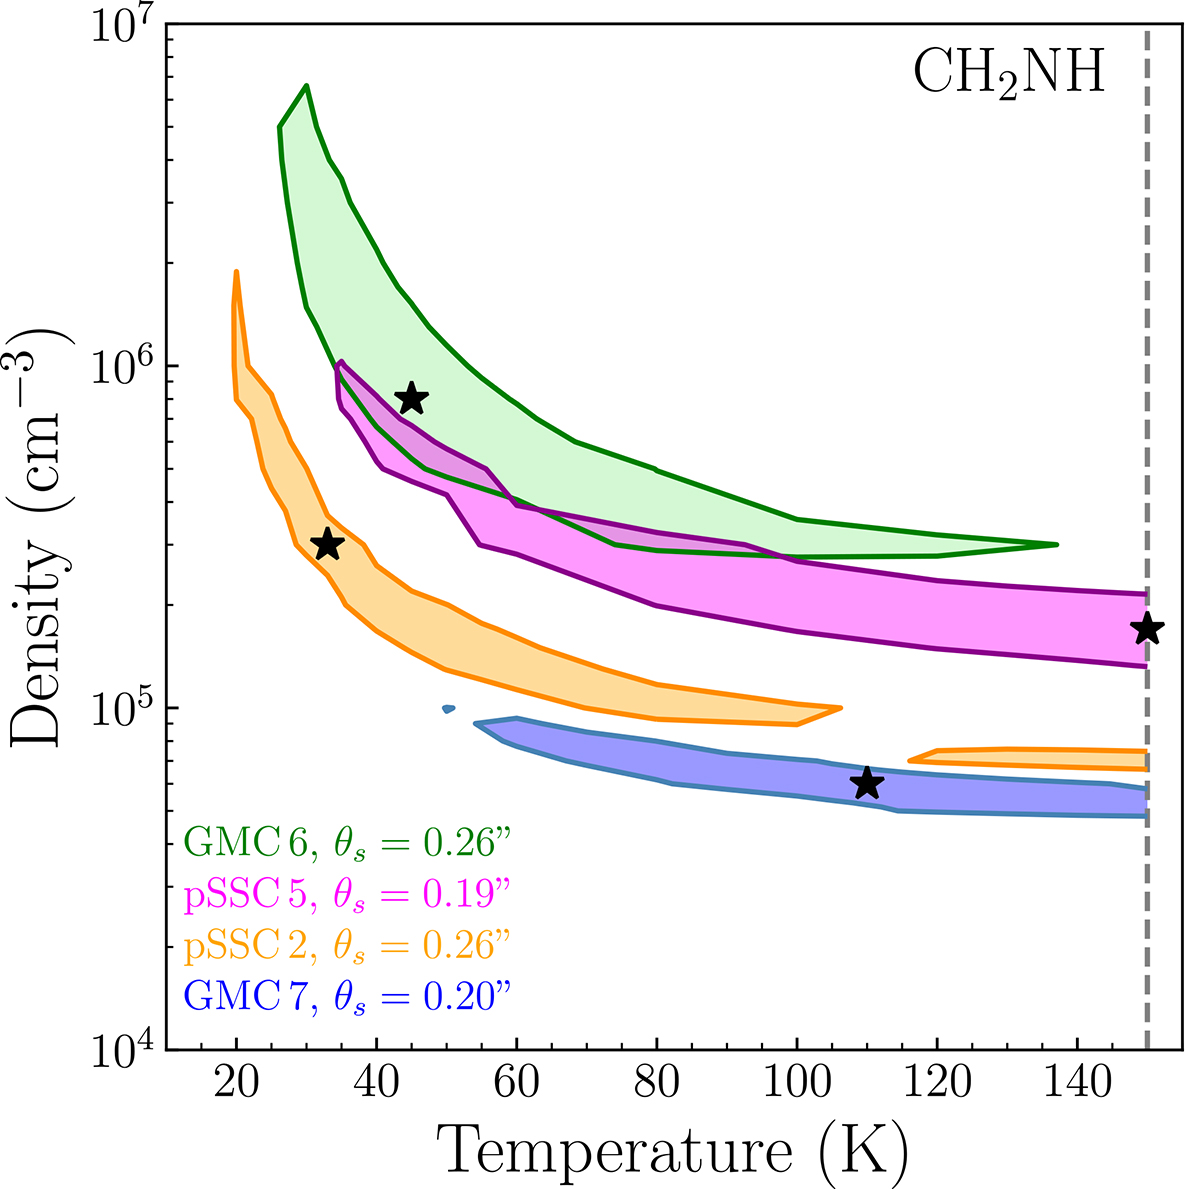
Volume density and kinetic temperature contour plots showing the results from the LVG analysis for CH2NH towards GMC 7 (blue), GMC 6 (green), pSSC 5 (magenta), and pSSC 2 (orange). The contours show the 1σ solutions obtained for the minimum ![]() value in the column density parameter. The best fits are marked by black stars, while the best fit for the emission size (θs) are indicated in the bottom-left corner of the figure. The vertical grey line indicates the maximum temperature at which the rates are calculated.
value in the column density parameter. The best fits are marked by black stars, while the best fit for the emission size (θs) are indicated in the bottom-left corner of the figure. The vertical grey line indicates the maximum temperature at which the rates are calculated.
Current usage metrics show cumulative count of Article Views (full-text article views including HTML views, PDF and ePub downloads, according to the available data) and Abstracts Views on Vision4Press platform.
Data correspond to usage on the plateform after 2015. The current usage metrics is available 48-96 hours after online publication and is updated daily on week days.
Initial download of the metrics may take a while.