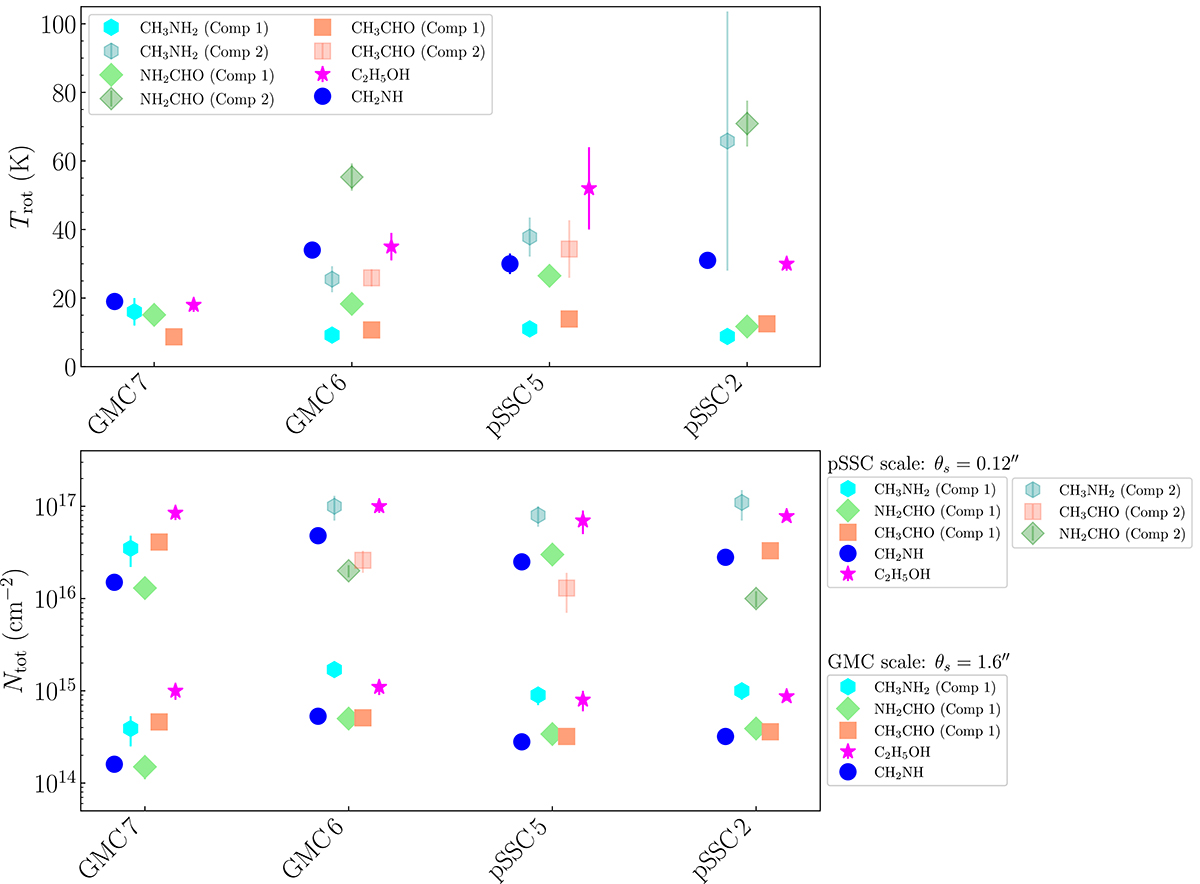
Fig. 4.
Download original image
Derived rotational temperature (Trot; top) and total column density (Ntot; bottom) for each species and region. The order of the regions follows the layout of the GMCs/SSCs of the CMZ from north-east to south-west as shown in Figure 1. Top: when two gas components were fitted in the RDs, the Trot of the two components are indicated. Bottom: column densities derived for GMC scales (θs = 1.6″; bottom part) and pSSC scales (θs = 0.12″; top part). For the species (CH2NH and C2H5OH) and region (GMC 7), where only one gas component was fitted, we calculated the column densities for the two scales. For the other regions and species, we attributed the first component to an emission coming from GMC scales and the second component to an emission coming from pSSC scales. In the cases of NH2CHO and CH3CHO, only one component was fitted for pSSC 2 and pSSC 5, respectively.
Current usage metrics show cumulative count of Article Views (full-text article views including HTML views, PDF and ePub downloads, according to the available data) and Abstracts Views on Vision4Press platform.
Data correspond to usage on the plateform after 2015. The current usage metrics is available 48-96 hours after online publication and is updated daily on week days.
Initial download of the metrics may take a while.