Fig. 3.
Download original image
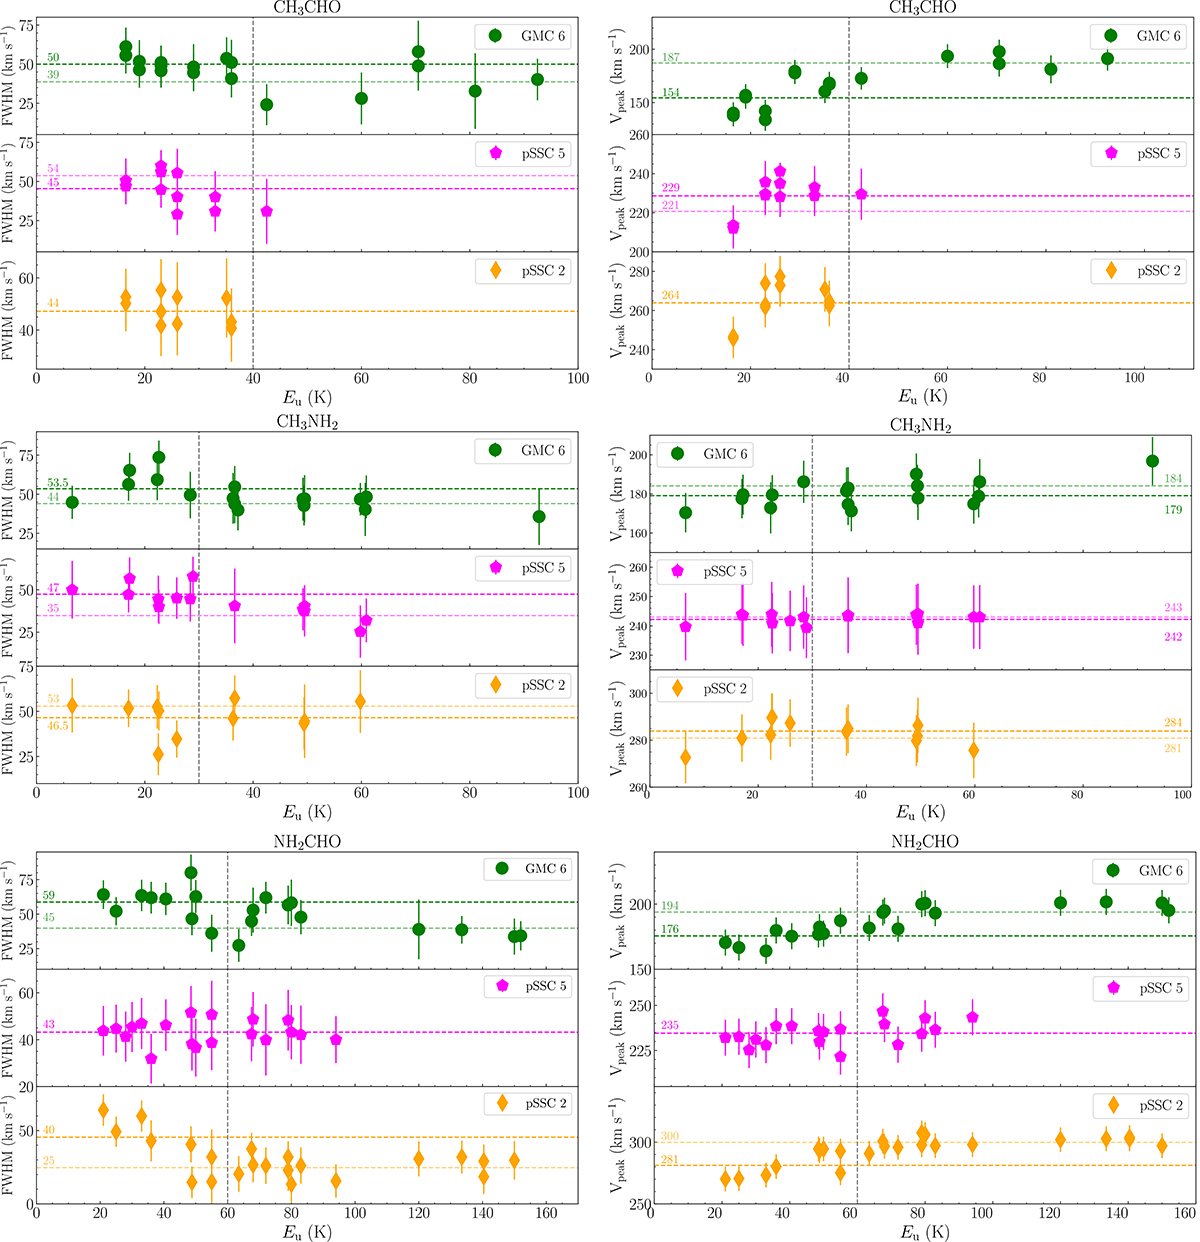
Line widths (FWHM; left-hand side) and peak velocities (Vpeak; right-hand side) as a function of upper level energies (Eu) for CH3OH (top panels), CH3NH2 (middle panels), and NH2CHO (bottom panels) and for GMC 6 (filled green circles), pSSC 5 (filled magenta pentagons), and pSSC 2 (filled orange diamonds). The vertical dashed grey lines indicate where the deviation in the RDs occurs, i.e. ∼40 K, 30 K, and 60 K for CH3CHO, CH3NH2, and NH2CHO, respectively. Only the most clear Gaussian fits have been used (see text). If a second component has been identified in the RDs, it is shown in lighter color. Mean FWHM and Vpeak are indicated on the plots by horizontal dashed lines accompanied with their corresponding values.
Current usage metrics show cumulative count of Article Views (full-text article views including HTML views, PDF and ePub downloads, according to the available data) and Abstracts Views on Vision4Press platform.
Data correspond to usage on the plateform after 2015. The current usage metrics is available 48-96 hours after online publication and is updated daily on week days.
Initial download of the metrics may take a while.