Open Access
Fig. 3
Download original image
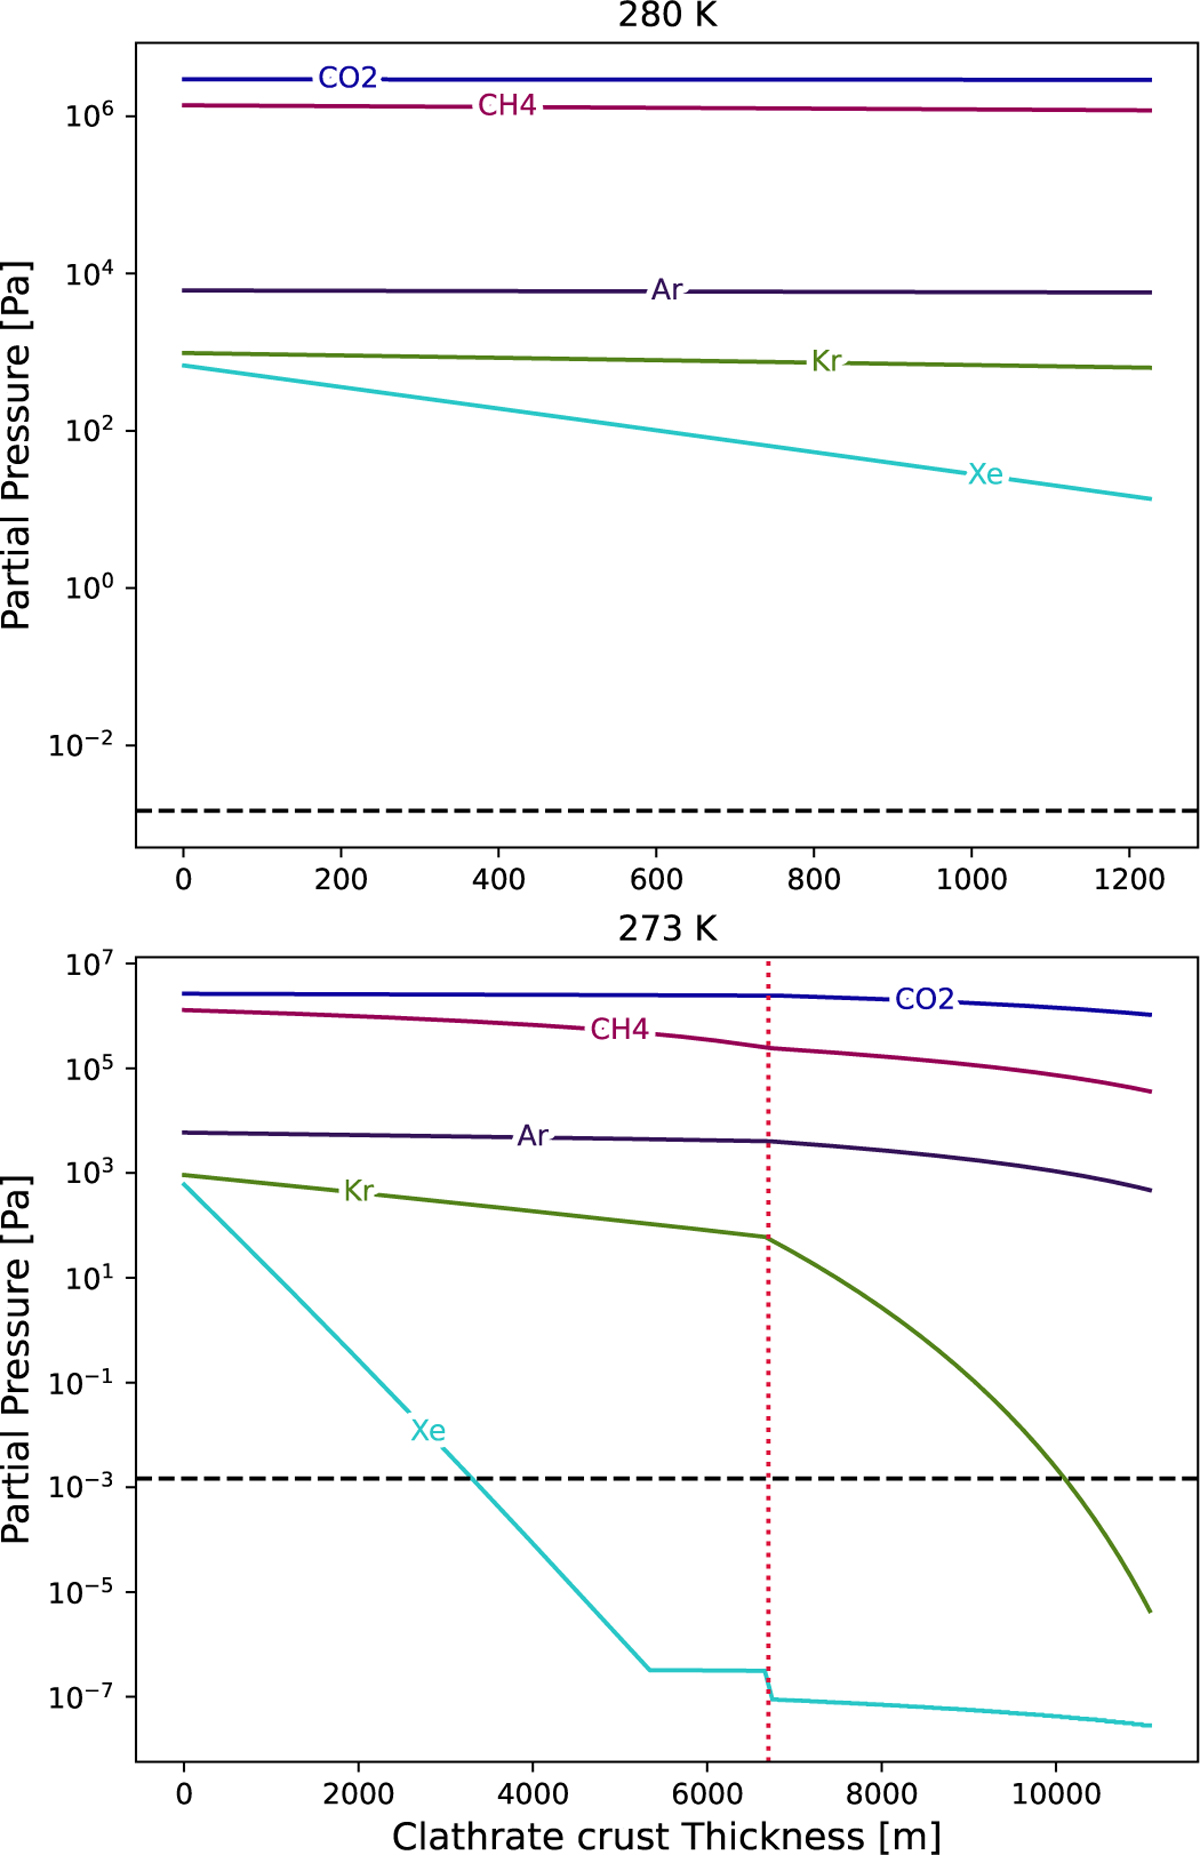
Evolution of atmospheric abundances as a function of clathrate crust thickness at 280 and 273.15 K. The dashed red line indicates the threshold at which the clathrate composition changes from CH4-rich to CO2-rich. The dashed black line represents the detection limit of Huygens’ GCMS.
Current usage metrics show cumulative count of Article Views (full-text article views including HTML views, PDF and ePub downloads, according to the available data) and Abstracts Views on Vision4Press platform.
Data correspond to usage on the plateform after 2015. The current usage metrics is available 48-96 hours after online publication and is updated daily on week days.
Initial download of the metrics may take a while.