Fig. 6.
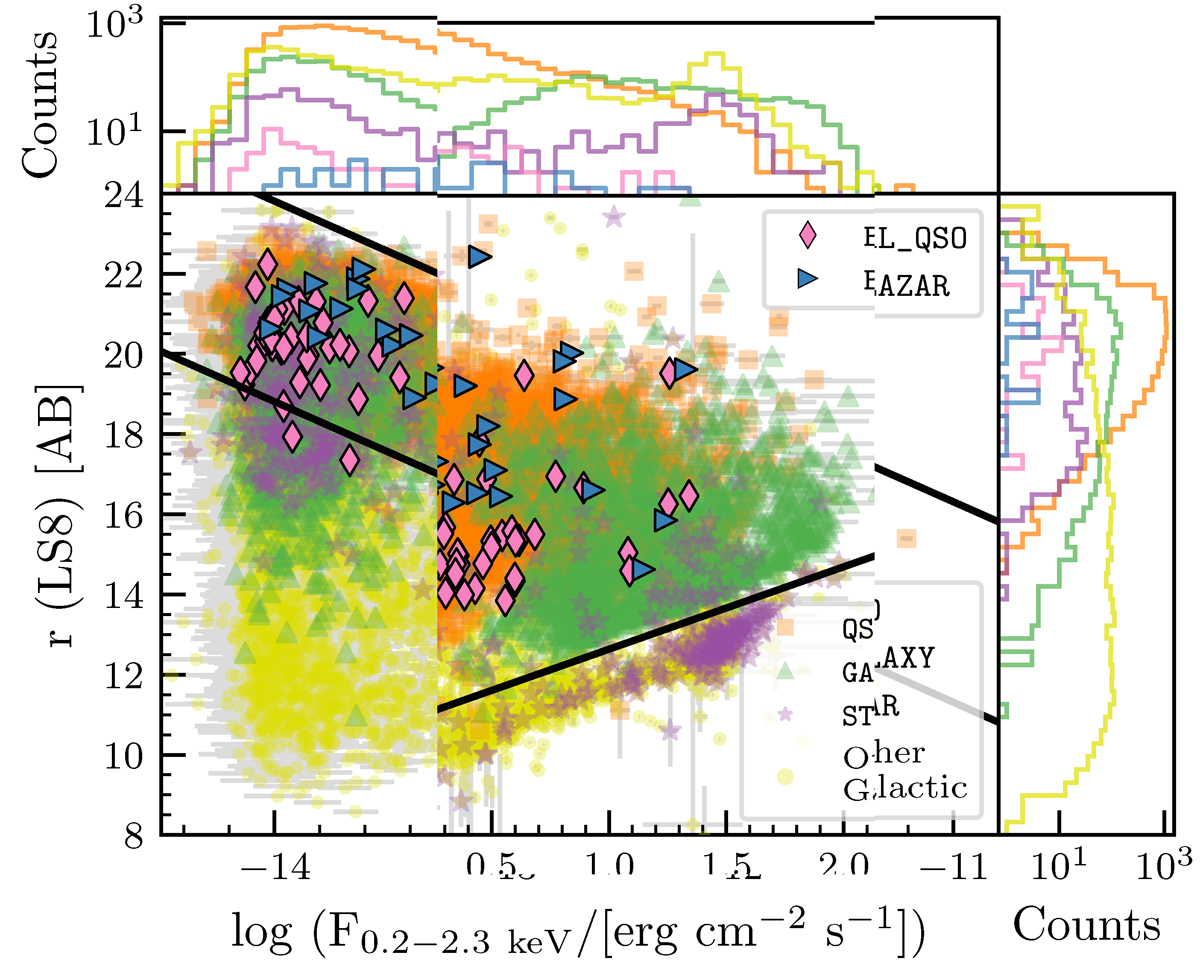
Download original image
X-ray flux vs. optical magnitude diagram of the sources with reliable redshifts after the visual inspection, except for BLAZARS and Other Galactic sources which have NORMQ ≠ 3. The sources are colour-coded as in Fig. 5. The region between the two lines defines the locus of quasars in this plane, adapted from Maccacaro et al. (1988).
Current usage metrics show cumulative count of Article Views (full-text article views including HTML views, PDF and ePub downloads, according to the available data) and Abstracts Views on Vision4Press platform.
Data correspond to usage on the plateform after 2015. The current usage metrics is available 48-96 hours after online publication and is updated daily on week days.
Initial download of the metrics may take a while.