Open Access
Fig. 3.
Download original image
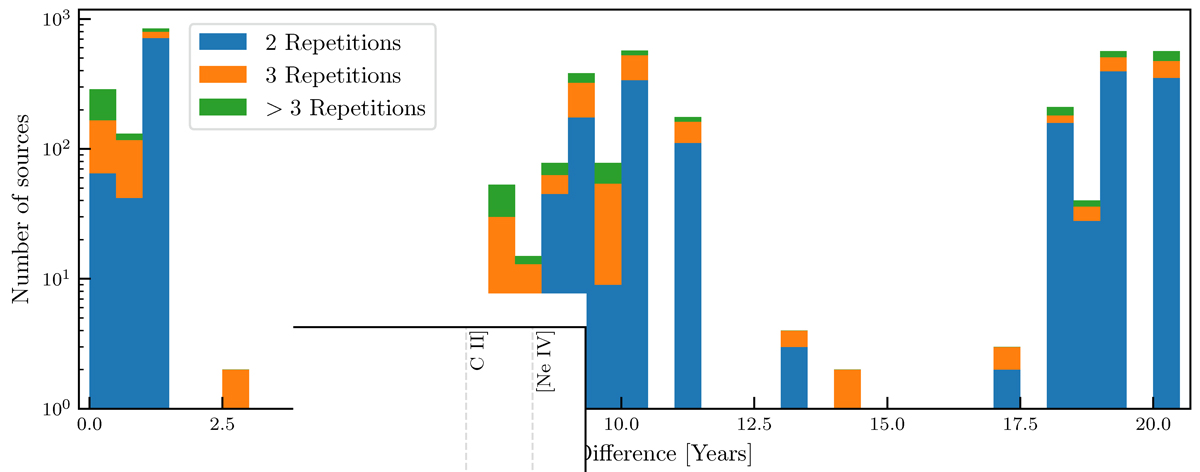
Difference in time between couples of SDSS spectroscopic observations of the same X-ray source, in years. The sources with 2 observations (blue), 3 observations (orange), and more than 3 observations (green) are summed up in this histogram display.
Current usage metrics show cumulative count of Article Views (full-text article views including HTML views, PDF and ePub downloads, according to the available data) and Abstracts Views on Vision4Press platform.
Data correspond to usage on the plateform after 2015. The current usage metrics is available 48-96 hours after online publication and is updated daily on week days.
Initial download of the metrics may take a while.