Open Access
Fig. 18.
Download original image
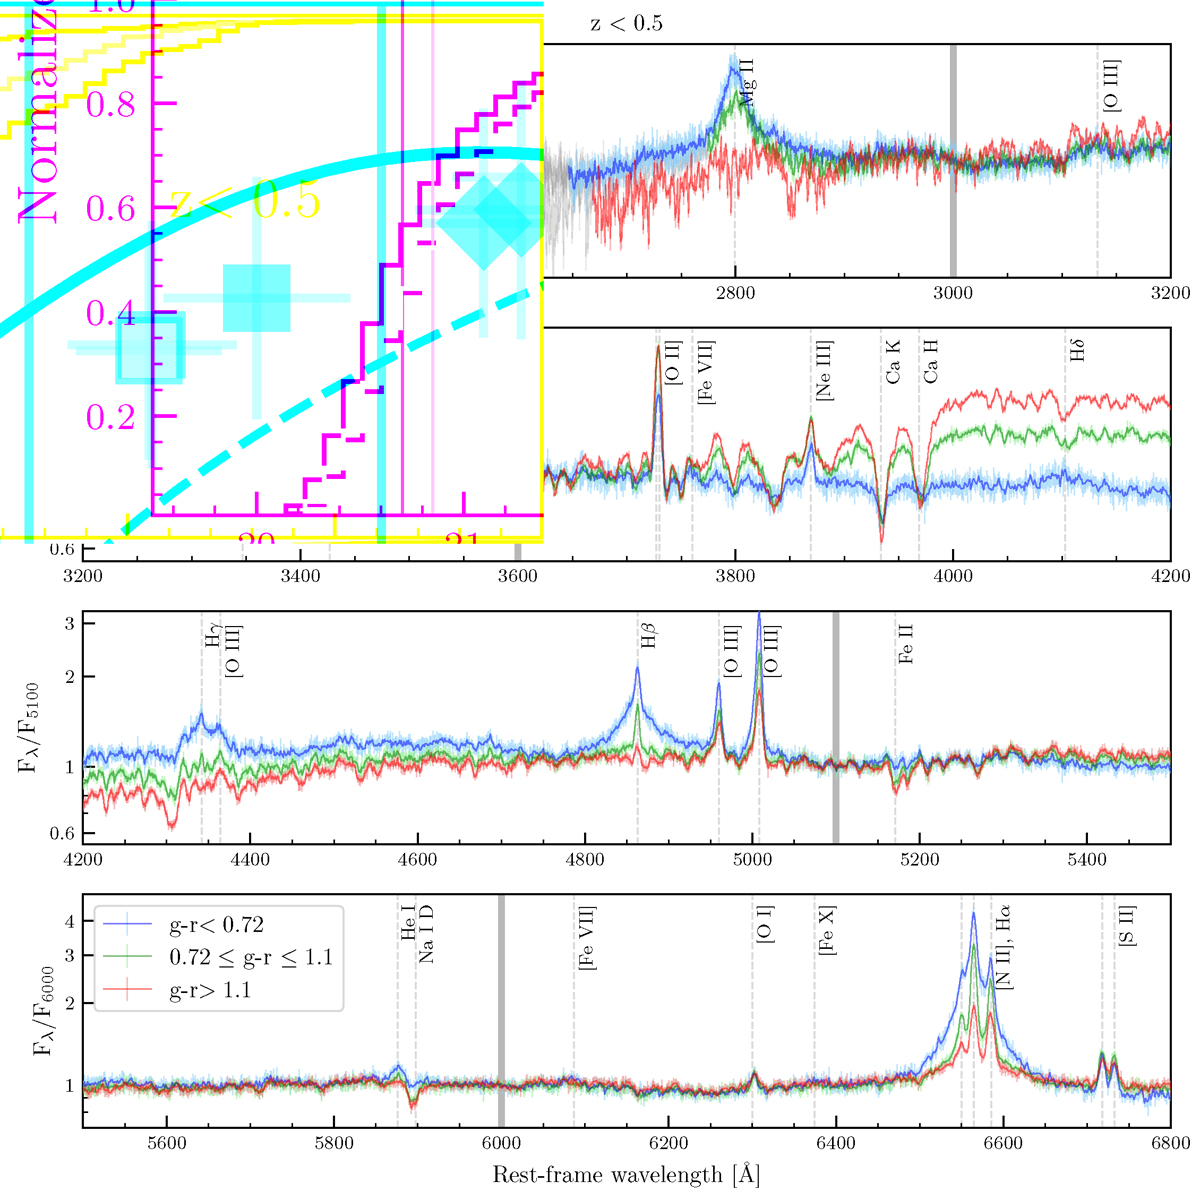
Zoomed-in version of the stacked spectra from Fig. 17. The emission and absorption lines are clearer, and the differences between the stacked colours are enhanced. The wavelength of the flux used for the normalisation of each plot is indicated in the ordinate axis and as a grey-filled vertical line.
Current usage metrics show cumulative count of Article Views (full-text article views including HTML views, PDF and ePub downloads, according to the available data) and Abstracts Views on Vision4Press platform.
Data correspond to usage on the plateform after 2015. The current usage metrics is available 48-96 hours after online publication and is updated daily on week days.
Initial download of the metrics may take a while.