Open Access
Fig. 16.
Download original image
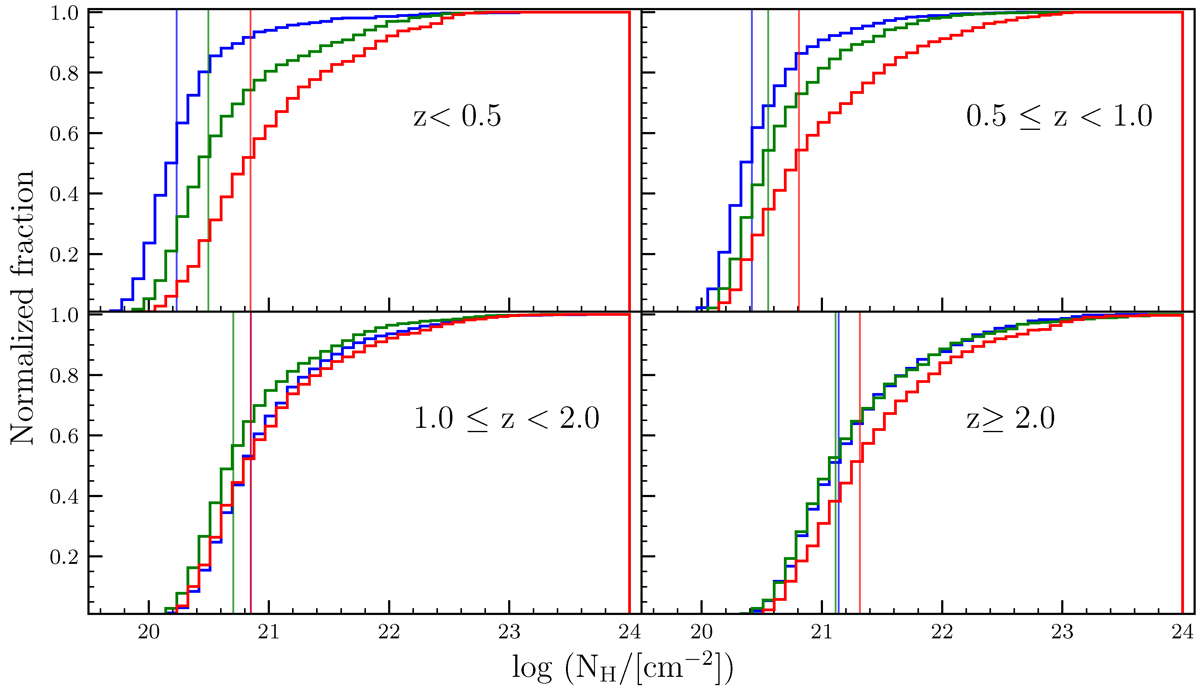
X-ray column density cumulative distribution per redshift and colour bin, as in Fig. 14. The vertical lines indicate the median of the column density for each bin, with the colours corresponding to the colour bin (red for the redder bin, green for the intermediate colour and blue for the bluer objects).
Current usage metrics show cumulative count of Article Views (full-text article views including HTML views, PDF and ePub downloads, according to the available data) and Abstracts Views on Vision4Press platform.
Data correspond to usage on the plateform after 2015. The current usage metrics is available 48-96 hours after online publication and is updated daily on week days.
Initial download of the metrics may take a while.