Fig. 14.
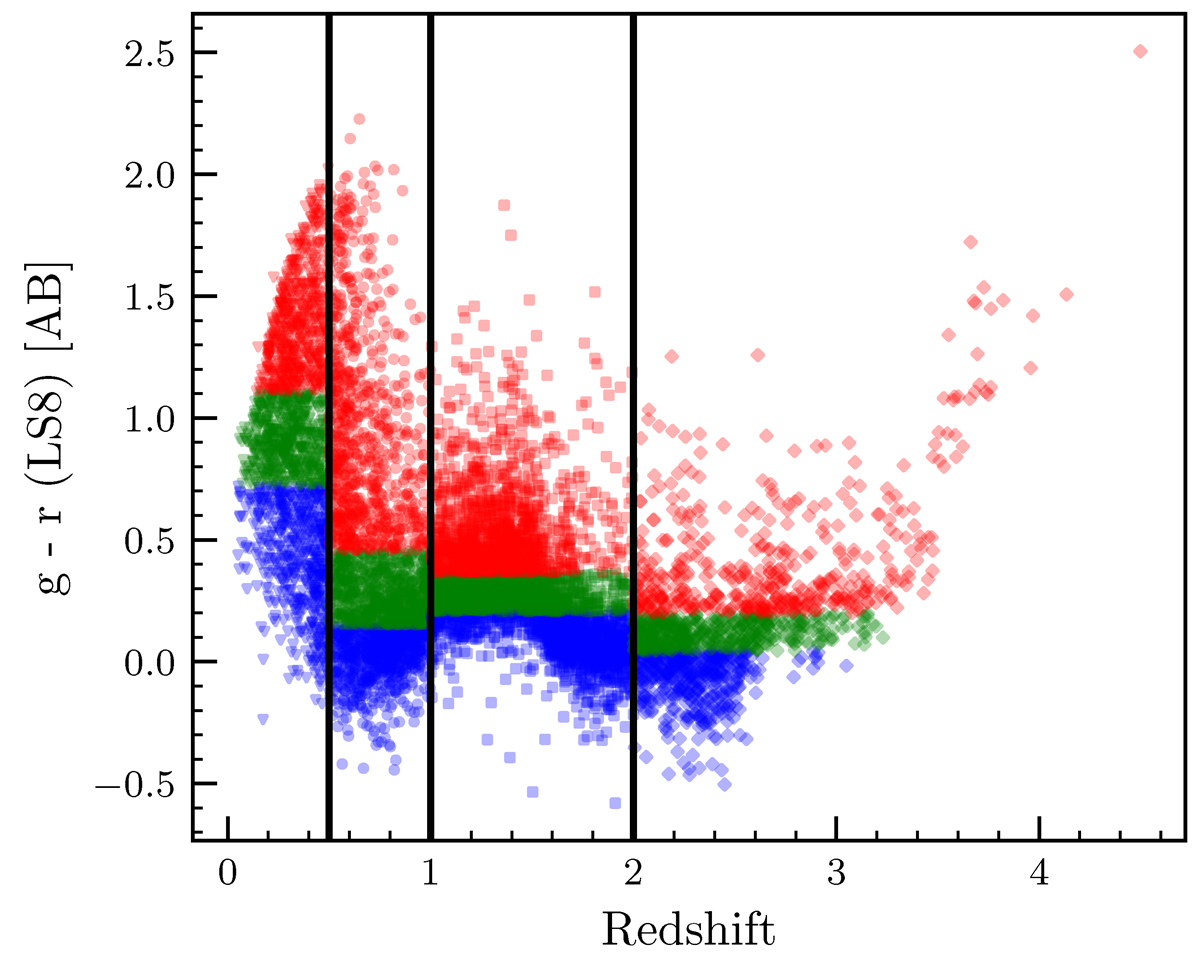
Download original image
Colour (g-r) and redshift distribution of the data used in the stacks from Figs. 17-24. The stacks considered four redshift bins separated by vertical lines, with triangles at z < 0.5, circles at 0.5 ≤ z < 1.0, squares at 1.0 ≤ z < 2.0, and diamonds at z ≥ 2.0. Each redshift bin was divided into three colour ranges with approximately the same number of sources per colour bin, shown as blue, green, and red.
Current usage metrics show cumulative count of Article Views (full-text article views including HTML views, PDF and ePub downloads, according to the available data) and Abstracts Views on Vision4Press platform.
Data correspond to usage on the plateform after 2015. The current usage metrics is available 48-96 hours after online publication and is updated daily on week days.
Initial download of the metrics may take a while.