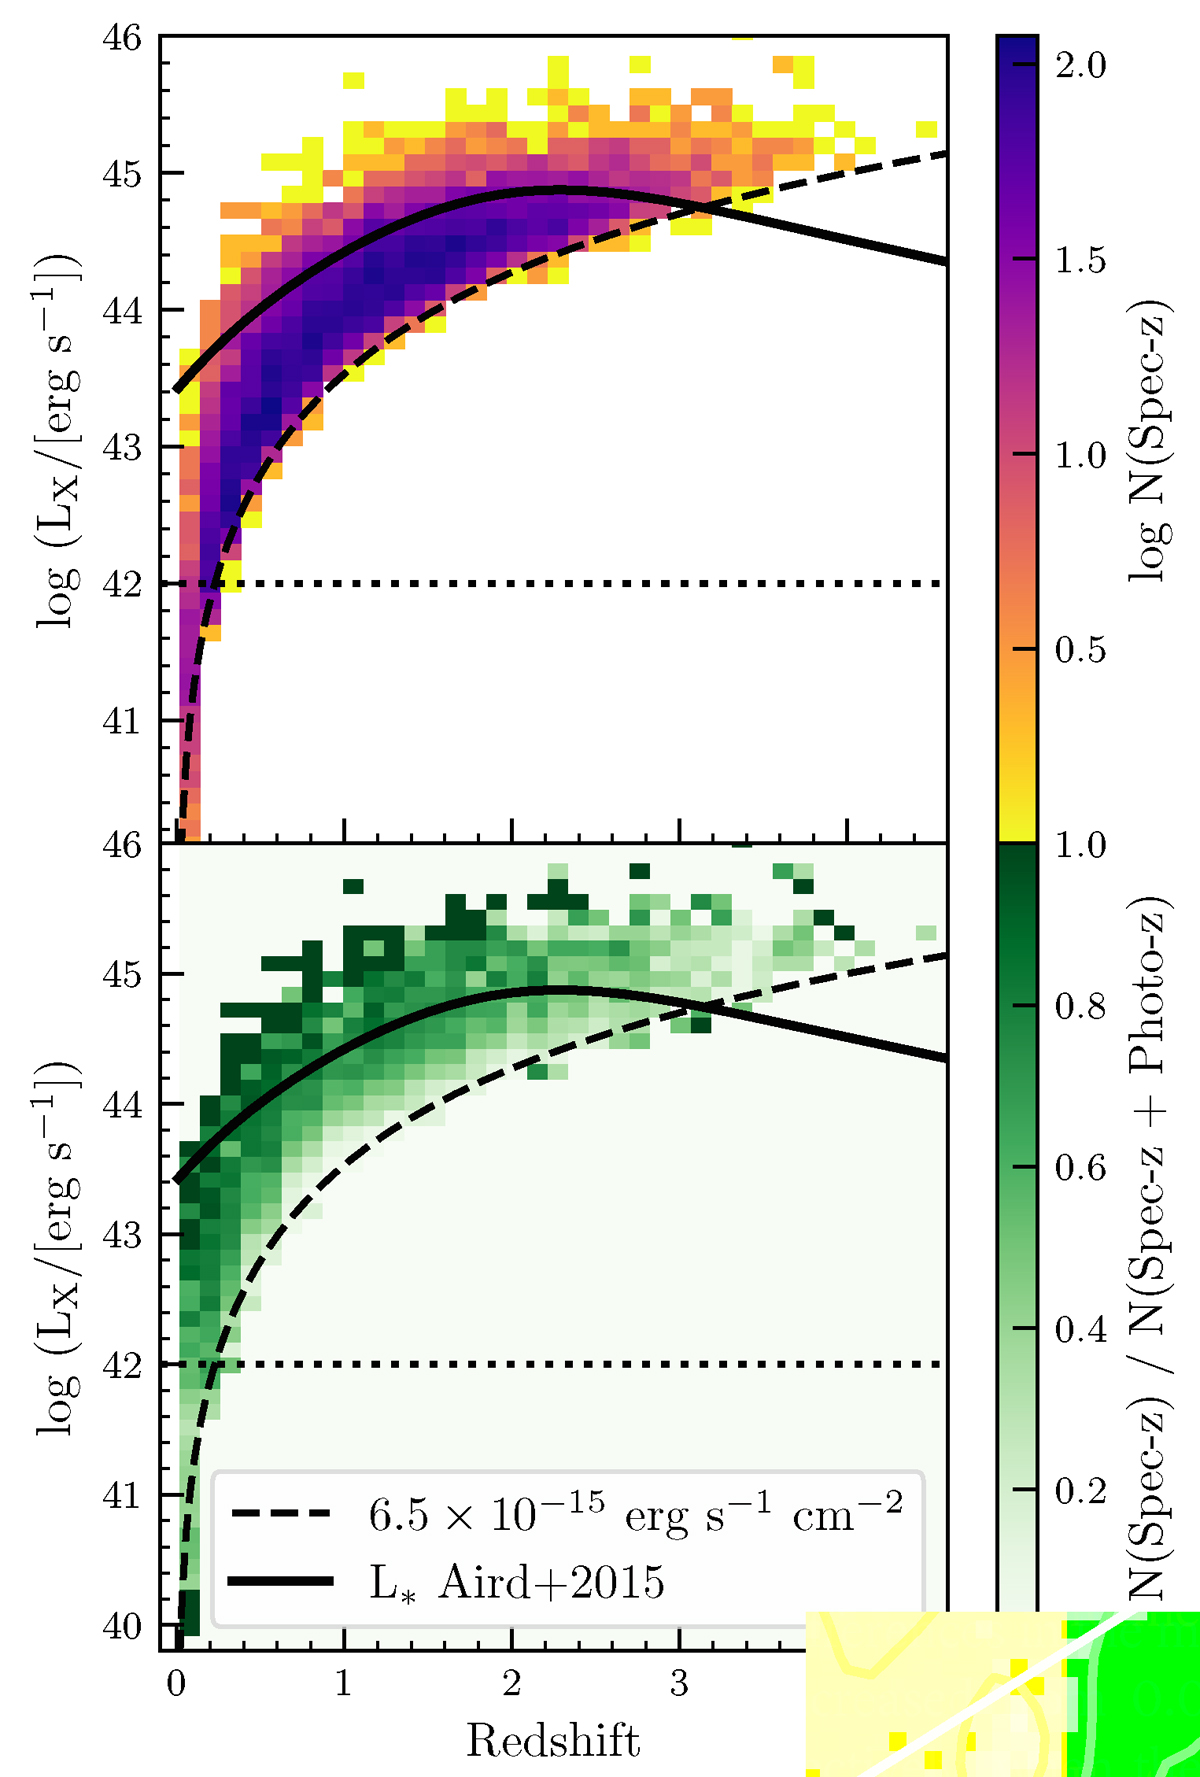
Fig. 12.
Download original image
Observed X-ray (0.2 − 2.3 keV) luminosity distribution as a function of redshift. The top panel is colour-coded according to the number density in the logarithmic scale, while the bottom panel is colour-coded by spectroscopic completeness. The dashed line indicates the flux limit of the eROSITA survey, while the filled line indicates the location of the knee of the soft X-ray luminosity function according to the LADE model of Aird et al. (2015). The dotted horizontal line indicates the limit of L0.2 − 2.3keV ≤ 1042 erg s−1 applied in Sect. 5 for a pure AGN selection.
Current usage metrics show cumulative count of Article Views (full-text article views including HTML views, PDF and ePub downloads, according to the available data) and Abstracts Views on Vision4Press platform.
Data correspond to usage on the plateform after 2015. The current usage metrics is available 48-96 hours after online publication and is updated daily on week days.
Initial download of the metrics may take a while.