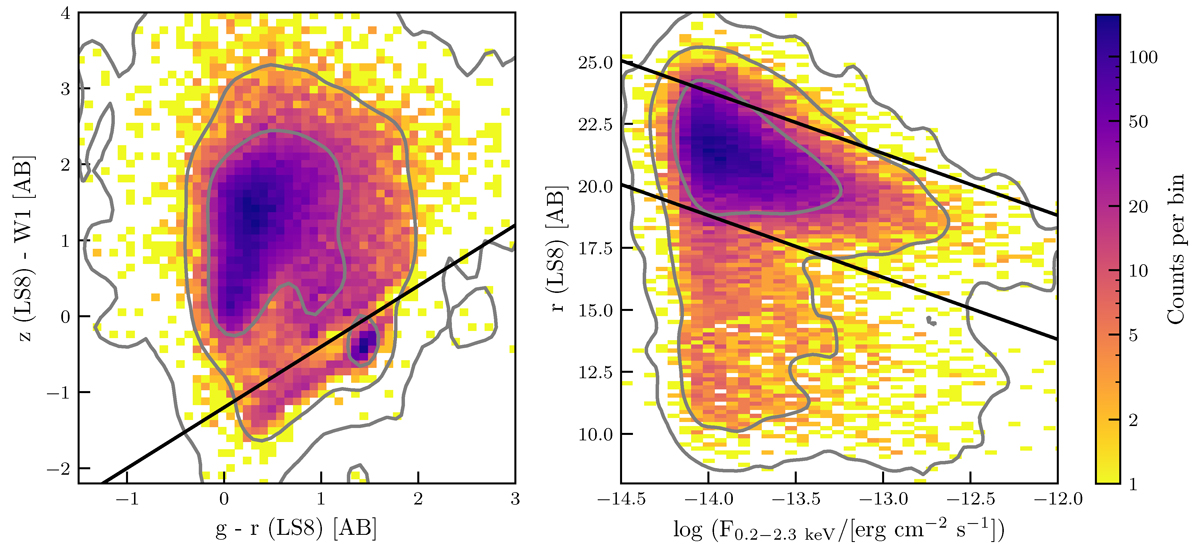
Fig. 10.
Download original image
Colour-colour and flux-magnitude diagrams for the objects from the full counterpart sample with a reliable photometric counterpart (CTP_QUALITY > 1, 24 774 sources), colour-coded by the data density per bin. The left panel presents z-W1 versus g − r, where g, r, and z are obtained from Legacy Survey DR8, and W1 is from WISE Survey. The line separates extragalactic sources on the top from Galactic sources on the bottom, according to Salvato et al. (2022). The right panel shows the r-band magnitude from the Legacy Survey DR8 versus the X-ray flux in the 0.2–2.3 keV band from eROSITA. The two lines adapted from Maccacaro et al. (1988) indicate the locus of quasars. Both panels exhibit their 1, 2, and 3σ contours in grey.
Current usage metrics show cumulative count of Article Views (full-text article views including HTML views, PDF and ePub downloads, according to the available data) and Abstracts Views on Vision4Press platform.
Data correspond to usage on the plateform after 2015. The current usage metrics is available 48-96 hours after online publication and is updated daily on week days.
Initial download of the metrics may take a while.