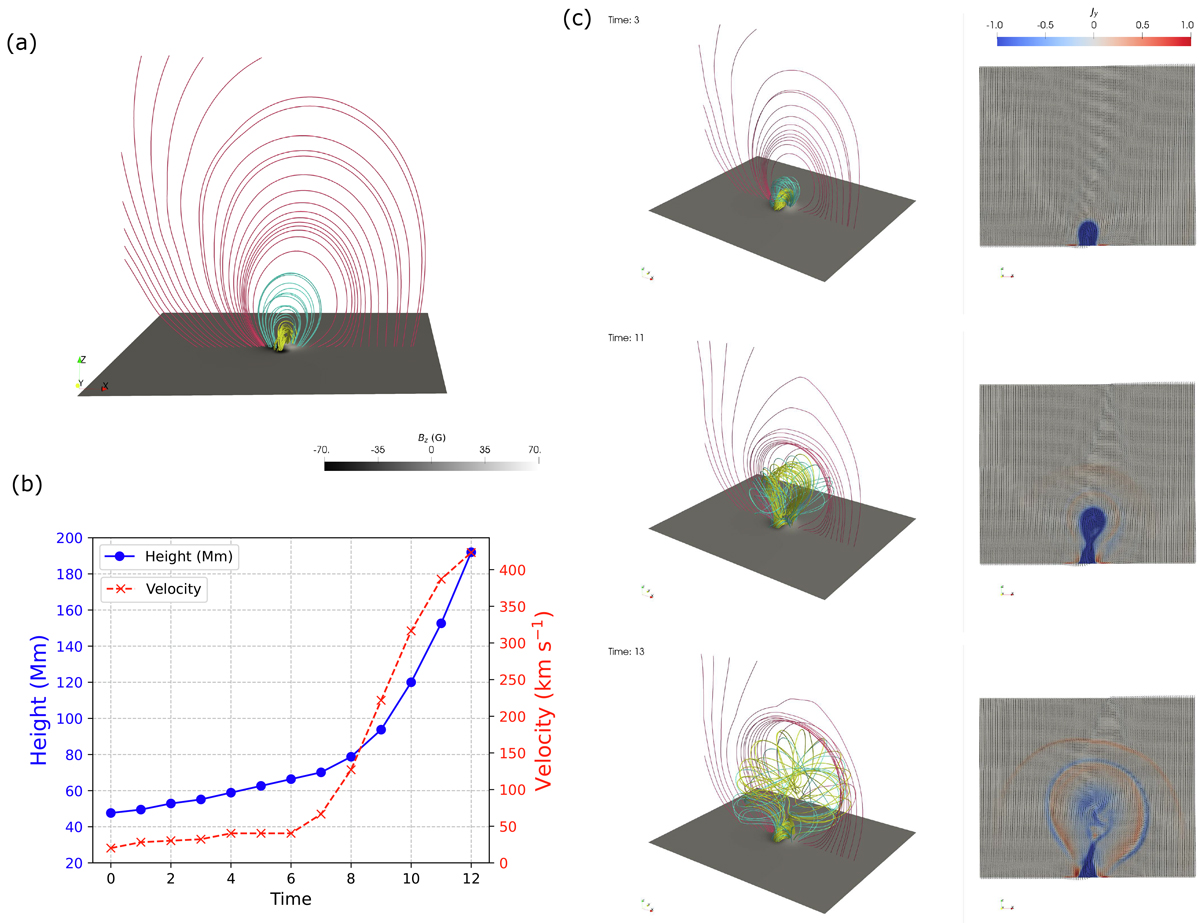
Fig. 4.
Download original image
Kinematics and 3D magnetic-field evolution of the eruption. Panel a shows the magnetic field configuration at the initial state. The yellow, cyan, and red-wine lines represent the preeruptive flux-rope field lines, the overlying active-region fields that are mainly generated by q1 and q2, and the large-scale background field lines extending from q3 and q4, respectively. Panel b shows the kinetics of the solar eruption, wherein the blue and red lines represent the evolution of the flux-rope axis height and velocity, respectively. Panel c illustrates the evolution of the 3D coronal magnetic fields and the Jy distribution in the x–z plane at t = 3τ0, 11τ0, and 13τ0. The animation of this figure is available online.
Current usage metrics show cumulative count of Article Views (full-text article views including HTML views, PDF and ePub downloads, according to the available data) and Abstracts Views on Vision4Press platform.
Data correspond to usage on the plateform after 2015. The current usage metrics is available 48-96 hours after online publication and is updated daily on week days.
Initial download of the metrics may take a while.