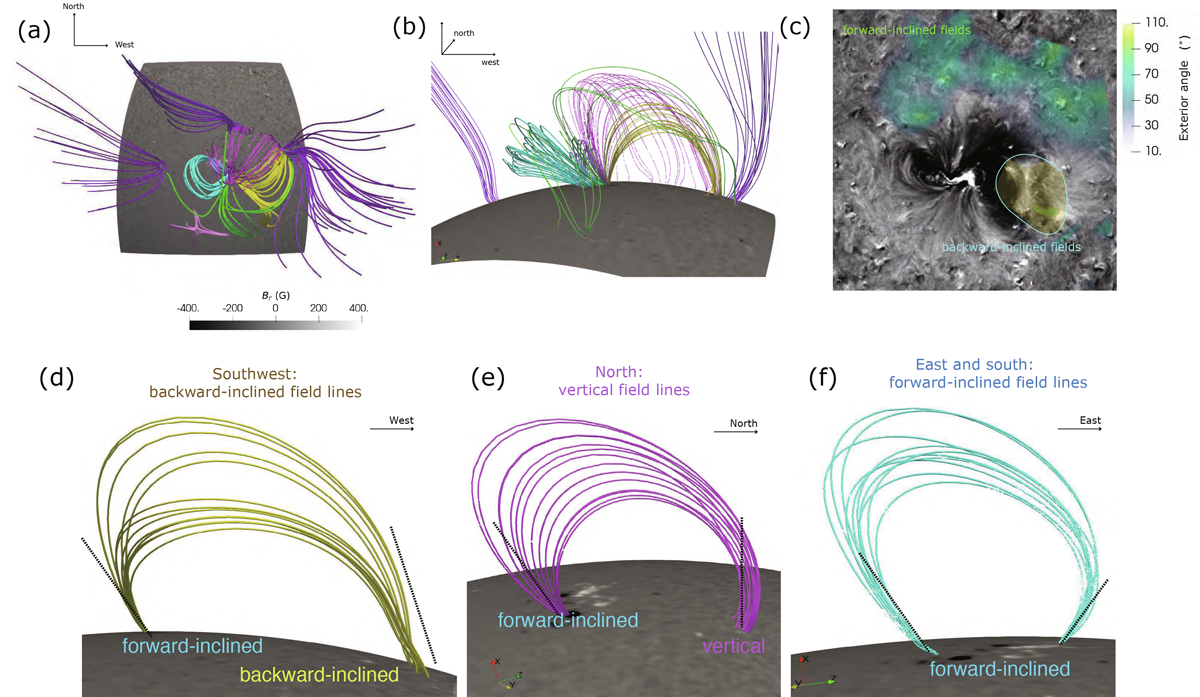
Fig. 3.
Download original image
Panels a–b: Top view and side view of the 3D coronal magnetic field reconstructed with the potential-field extrapolation; panel c: Distribution of the exterior angle (color scale) overlaid on the SDO/AIA 193 Å map at 03:15:04 UT; panels d–f: Selected field lines, indicating those field lines traced from the western (yellow) and northern (magenta) regions. These are more backward inclined compared to those from the eastern (cyan) and southern (green) regions.
Current usage metrics show cumulative count of Article Views (full-text article views including HTML views, PDF and ePub downloads, according to the available data) and Abstracts Views on Vision4Press platform.
Data correspond to usage on the plateform after 2015. The current usage metrics is available 48-96 hours after online publication and is updated daily on week days.
Initial download of the metrics may take a while.