Fig. 2.
Download original image
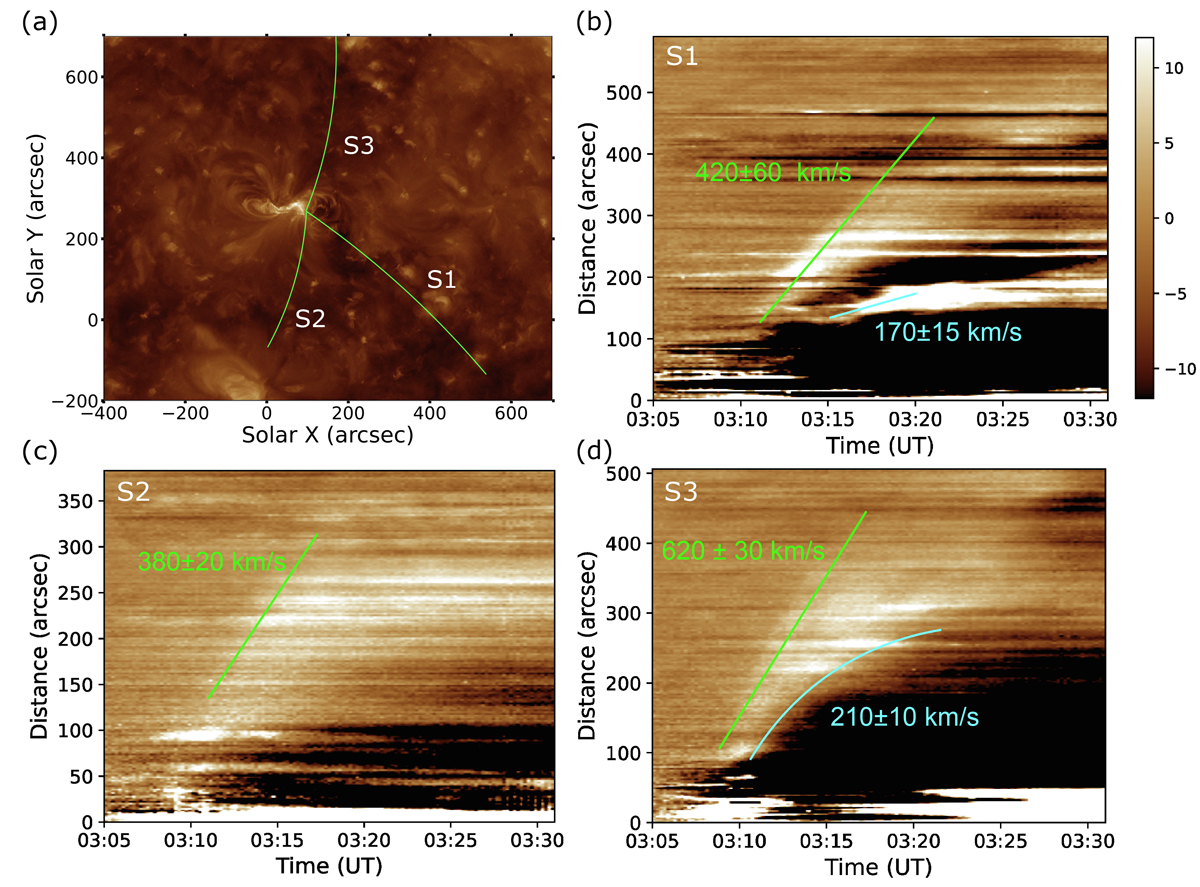
Time-distance diagrams of the base-difference intensity at EUV 193 Å channel along slices S1 (southwest, panel b), S2 (south, panel c), and S3 (north, panel d). The slice trajectories are marked in panel a. Two wave fronts and the fitting speeds are shown in panels b and d, while only one wave is visible in panel c. Note that both the fast MHD wave component (green lines) and the slower non-wave component (cyan lines), accompanied by pronounced expanding dimmings, are visible along slices S1 and S3, whereas only the fast MHD wave component can be clearly identified along slice S2. The error bars are estimated from the upper and lower boundaries of wave fronts.
Current usage metrics show cumulative count of Article Views (full-text article views including HTML views, PDF and ePub downloads, according to the available data) and Abstracts Views on Vision4Press platform.
Data correspond to usage on the plateform after 2015. The current usage metrics is available 48-96 hours after online publication and is updated daily on week days.
Initial download of the metrics may take a while.