Open Access
Fig. 1.
Download original image
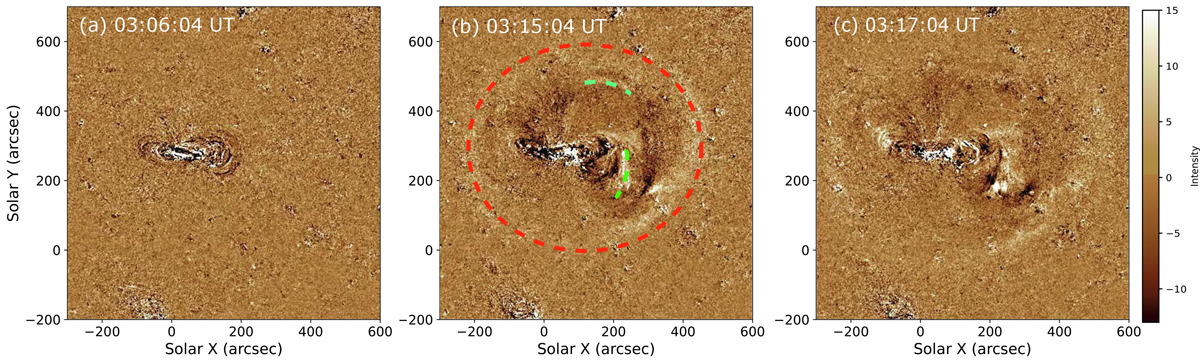
SDO/AIA 193 Å running-difference images illustrating the evolution of the EUV wave on 8 March 2019. The base time is 24 s earlier for each panel. The dashed red and green lines represent the two-component wave fronts in panel b. The animation of this figure is available online.
Current usage metrics show cumulative count of Article Views (full-text article views including HTML views, PDF and ePub downloads, according to the available data) and Abstracts Views on Vision4Press platform.
Data correspond to usage on the plateform after 2015. The current usage metrics is available 48-96 hours after online publication and is updated daily on week days.
Initial download of the metrics may take a while.