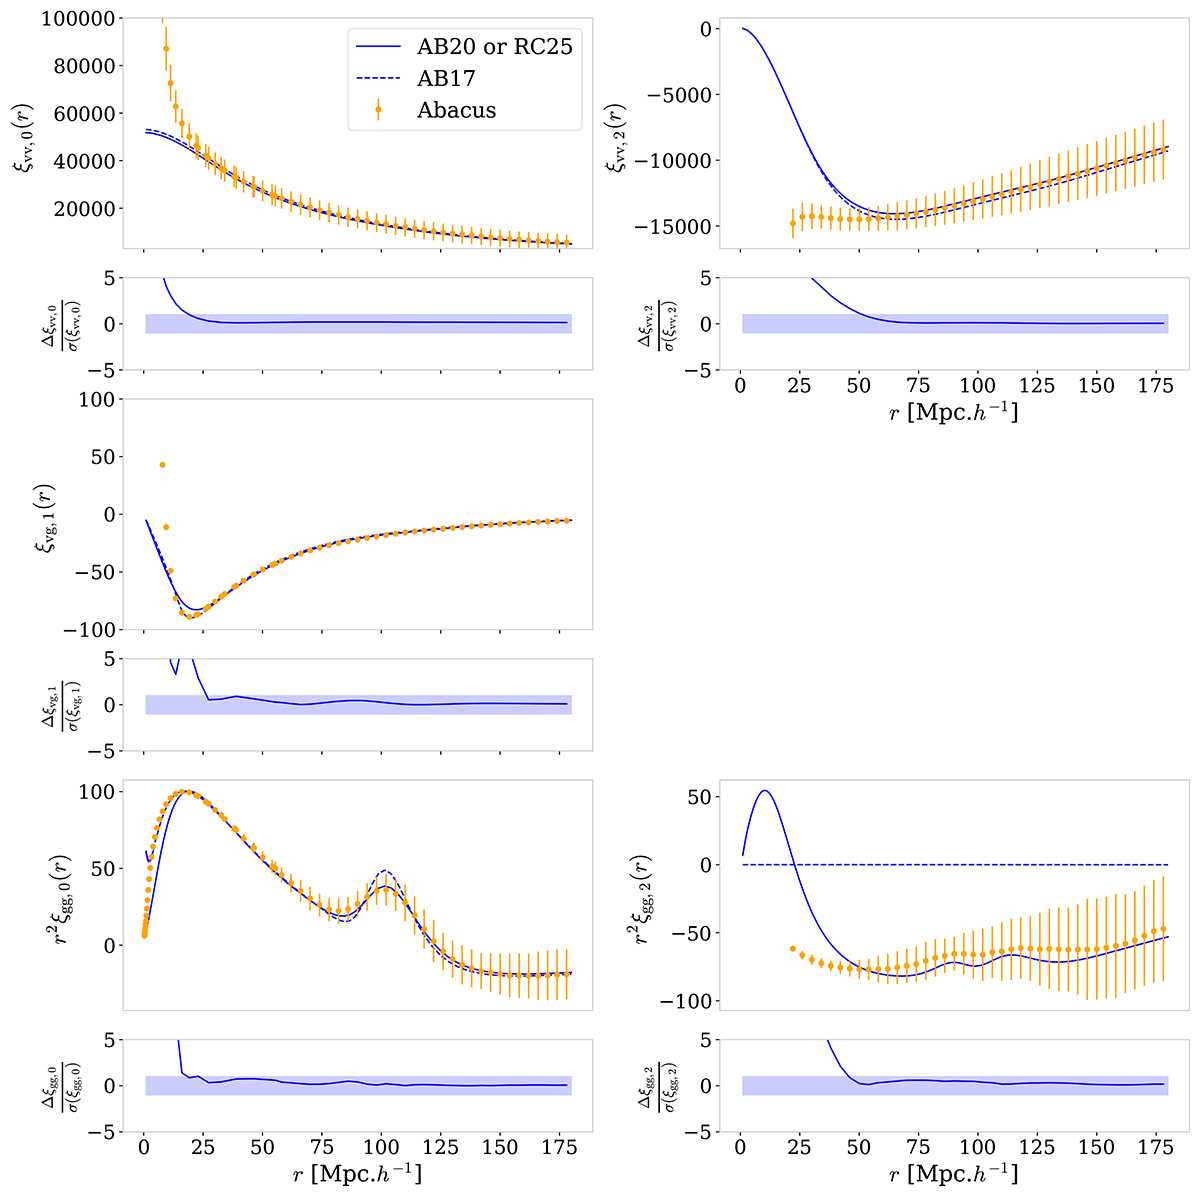
Fig. 9.
Download original image
Representation of the vv monopole (top left), quadrupole (top right), vg dip (middle left), gg monopole (bottom left) and quadrupole (bottom right) of the two-point correlation functions estimated on the AbacusSummit baseline halo catalog. The orange points are the average of the measurement over 25 simulations, and their associated error bar corresponds the standard deviation over those simulations, rescaled in volume to a sphere of maximal redshift z = 0.1. The plain (RC25) and dashed (AB17) blue lines are the best-fit models determined with flip covariance contraction. The lower panel of each monopole shows the absolute difference between RC25 model and the AbacusSummit multipoles, normalized by the multipole error bars.
Current usage metrics show cumulative count of Article Views (full-text article views including HTML views, PDF and ePub downloads, according to the available data) and Abstracts Views on Vision4Press platform.
Data correspond to usage on the plateform after 2015. The current usage metrics is available 48-96 hours after online publication and is updated daily on week days.
Initial download of the metrics may take a while.