Fig. 10.
Download original image
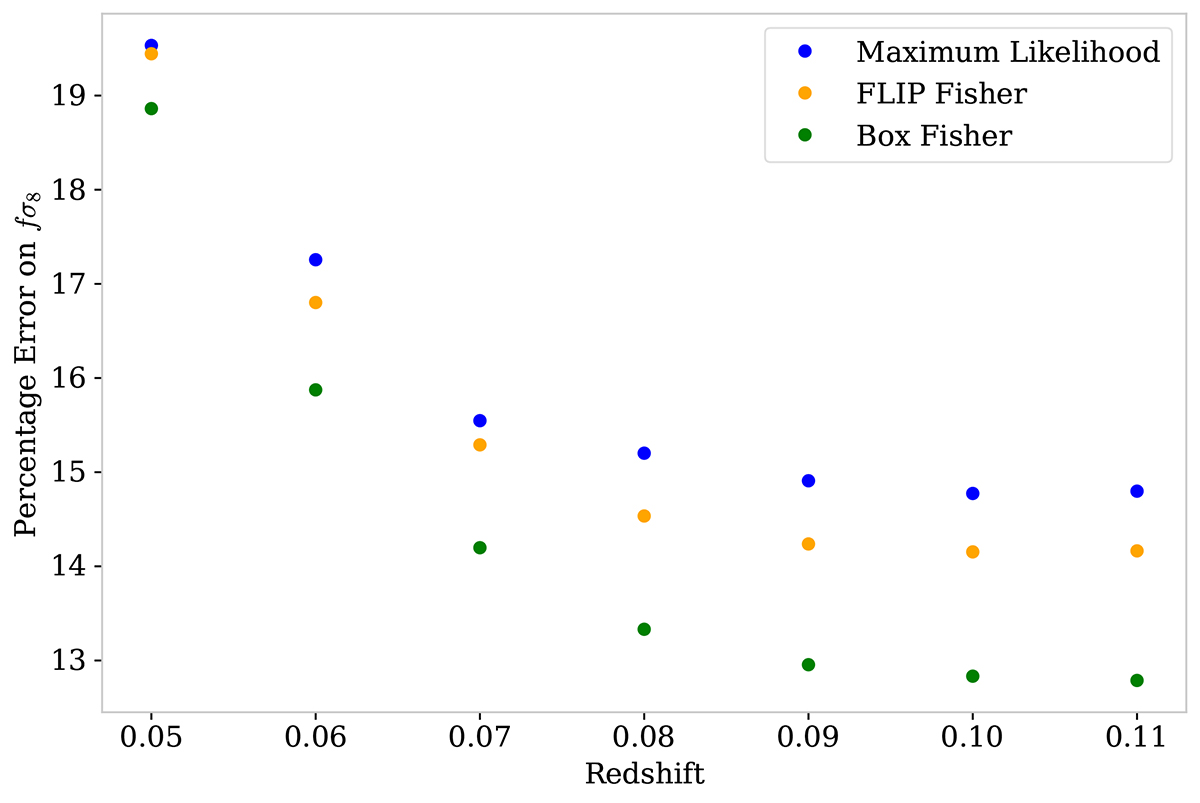
Percentage error on fσ8 for different redshift bins. The orange points show the results for our flip Fisher forecast, the green points the results for the standard volume Fisher, and the blue points the ones for the likelihood-based method. The results are obtained for different redshift bins with the same minimum redshift, zmin = 0.02, and increasing maximum redshift. The results are plotted at the maximum redshift of each bin and are the average over 27 realizations of a ZTF 6-year survey.
Current usage metrics show cumulative count of Article Views (full-text article views including HTML views, PDF and ePub downloads, according to the available data) and Abstracts Views on Vision4Press platform.
Data correspond to usage on the plateform after 2015. The current usage metrics is available 48-96 hours after online publication and is updated daily on week days.
Initial download of the metrics may take a while.