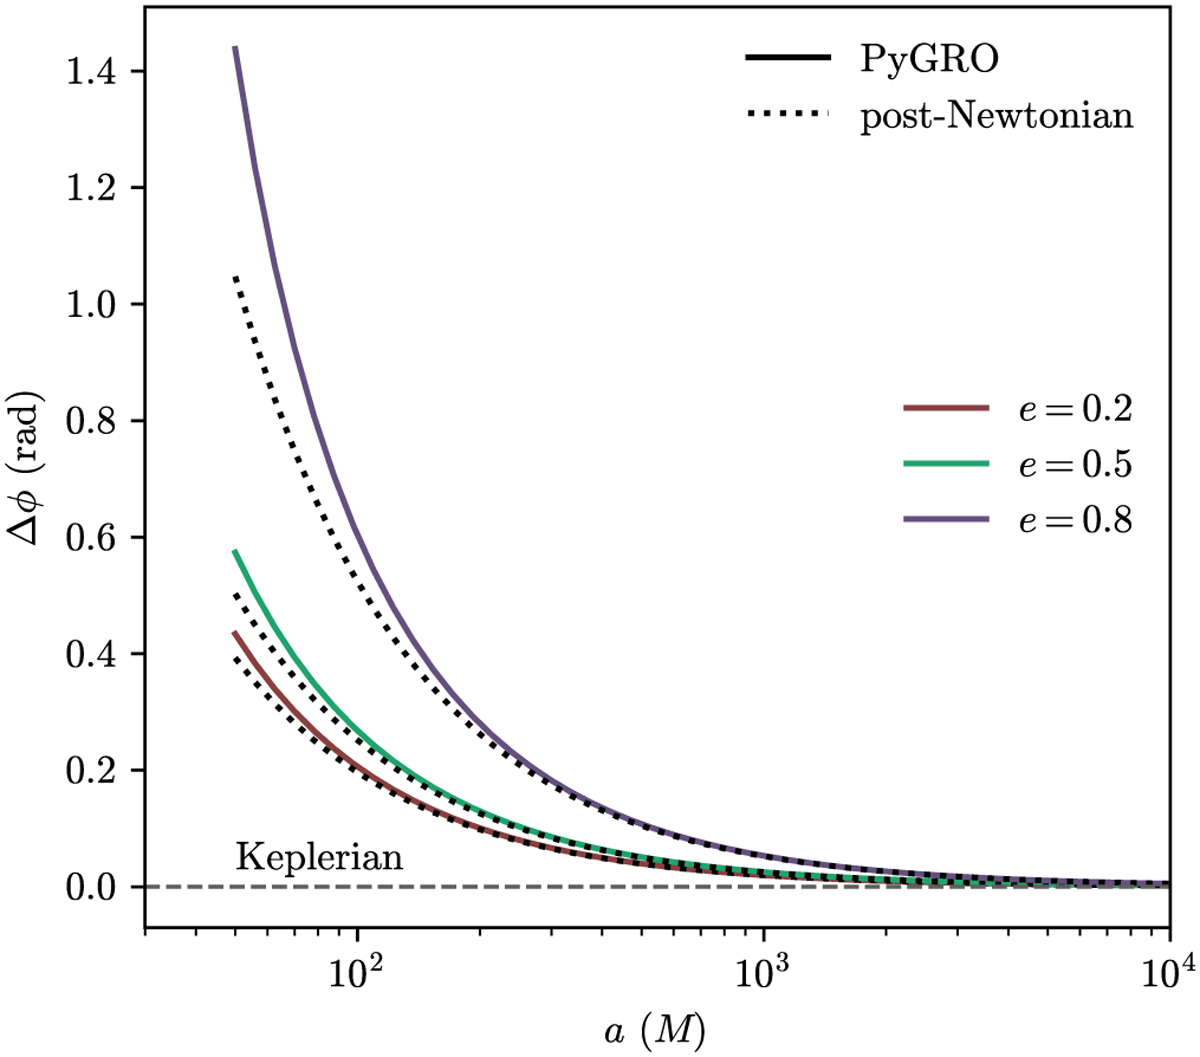
Fig. 6
Download original image
Rate of orbital precession for orbits with a ∈ [50, 10 000] and for three values of the eccentricity, e = 0.2, 0.5, and 0.8. The solid lines correspond to the rate of precession computed with PyGRO, while the dotted lines represent the post-Newtonian prediction for the same orbits, computed with the formula in Eq. (24). PyGRO correctly recovers the values of the predicted rate of precession for systems in the weak field regime. Also, for systems that scan increasingly strong gravitational regimes (e.g., a ≲ 100M in the low-eccentricity cases or even a ≲ 1000M for higher eccentricities), the fully relativistic computations in PyGRO allow one to go beyond the first-order post-Newtonian prediction and correctly account for an additional contribution to the periastron advance.
Current usage metrics show cumulative count of Article Views (full-text article views including HTML views, PDF and ePub downloads, according to the available data) and Abstracts Views on Vision4Press platform.
Data correspond to usage on the plateform after 2015. The current usage metrics is available 48-96 hours after online publication and is updated daily on week days.
Initial download of the metrics may take a while.