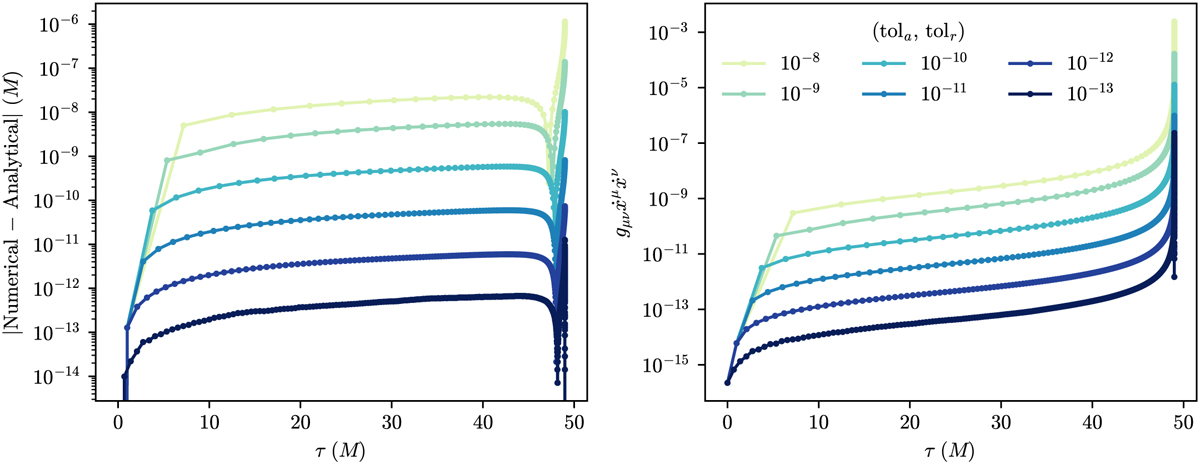
Fig. 14
Download original image
Convergence check of the numerical integration routine in PyGRO. In particular, for the same case illustrated in Fig. 13, with r0 = 50M, we compute the difference (left panel) between the known analytical results, Eq. (43) and the results obtained in PyGRO, for different values of the precision and accuracy tolerances (Eq. (6)) that we vary over six orders of magnitude. The plots shows the convergence of the numerical result to the analytical one as the integration tolerances are reduced. Moreover, we compute on the integrated geodesic the norm of the tangent four-vector (right panel) which, following Eq. (3), should be identically zero. The plot reports the amount of constraint violation, which shows convergence to zero as the integration precision is improved, thus validating the numerical routines implemented in PyGRO.
Current usage metrics show cumulative count of Article Views (full-text article views including HTML views, PDF and ePub downloads, according to the available data) and Abstracts Views on Vision4Press platform.
Data correspond to usage on the plateform after 2015. The current usage metrics is available 48-96 hours after online publication and is updated daily on week days.
Initial download of the metrics may take a while.