Fig. 11
Download original image
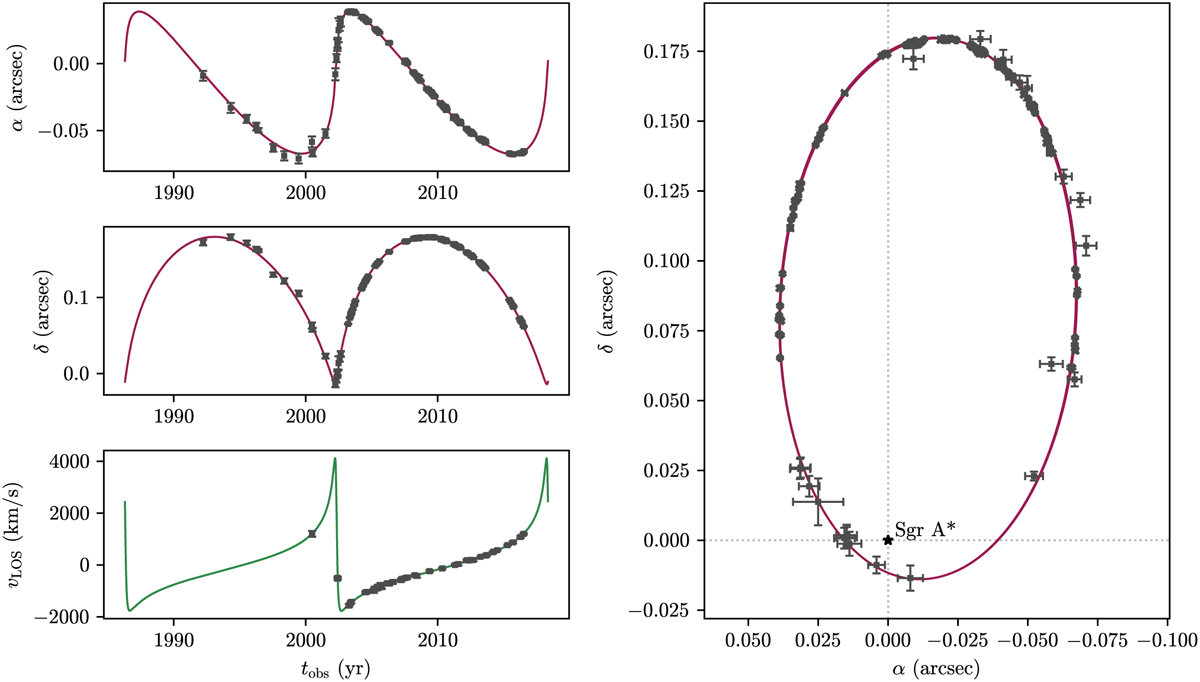
Full set of observables for S2 in the Galactic Center reconstructed from the geodesic integration with PyGRO. In particular, in the left panels we show the right ascension (top panel) and declination (middle panel) relative to Sgr A* of S2 over two full orbital periods and the fully relativistic line-of-sight velocity (bottom panel). In the right panel, we display the full apparent trajectory in the sky relative to Sgr A*. The black dots correspond to the publicly available astrometric and spectroscopic data for S2 from Gillessen et al. (2017) with their corresponding error.
Current usage metrics show cumulative count of Article Views (full-text article views including HTML views, PDF and ePub downloads, according to the available data) and Abstracts Views on Vision4Press platform.
Data correspond to usage on the plateform after 2015. The current usage metrics is available 48-96 hours after online publication and is updated daily on week days.
Initial download of the metrics may take a while.