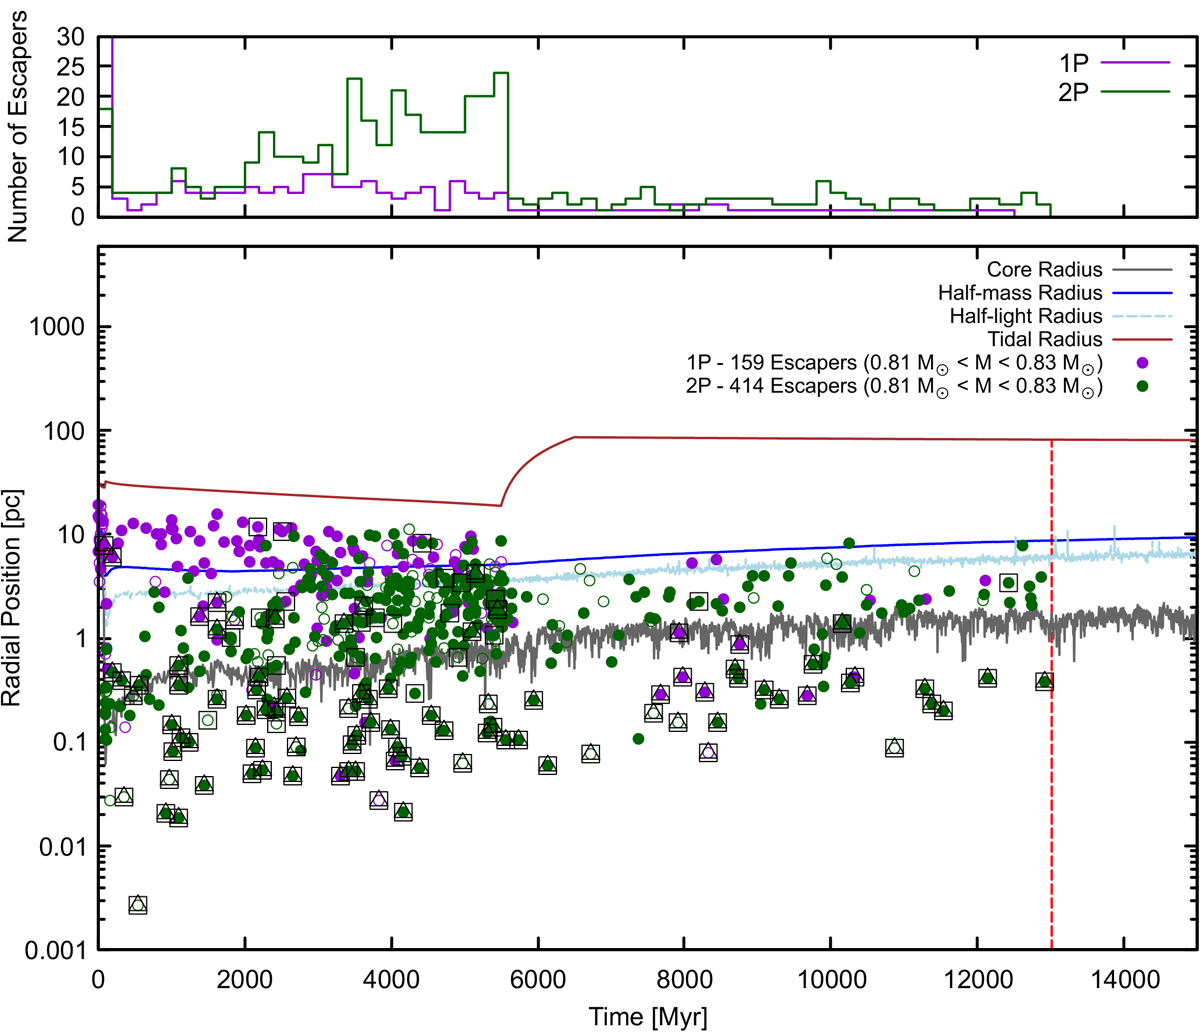
Fig. 3.
Download original image
The lower panel: Escape time versus radial position for dynamically ejected present-day RGB progenitor stars with initial masses between 0.81 and 0.83 M⊙. Each point represents a present-day RGB progenitor that escaped due to a strong three-body (binary-single) or four-body (binary-binary) encounter. The x axis shows the escape time, and the y axis indicates the radial position within the cluster at which the escape-causing interaction occurred. Superimposed lines trace the evolution of the core radius (Rc, grey), half-mass radius (Rh, dark blue), half-light radius (Rhl, light blue), and tidal radius (Rt, brown). Violet points represent 1P escapers, and green points represent 2P escapers; filled symbols denote single stars, and open symbols denote binaries. Triangles indicate stars that escaped directly due to an encounter involving at least one BH, while squares indicate stars that had at least one such BH encounter during their dynamical history. Of the 159 1P escapers, 20 (12.6%) experienced BH interactions; among the 414 2P escapers, 96 (23.2%) were involved in BH interactions. The vertical dashed red line marks the 13 Gyr snapshot, where the 1P overconcentration is most evident. The top panel: Histograms of escape times for both populations, binned in 200 Myr intervals, highlighting the higher escape rate of 2P RGB progenitors from strong encounters.
Current usage metrics show cumulative count of Article Views (full-text article views including HTML views, PDF and ePub downloads, according to the available data) and Abstracts Views on Vision4Press platform.
Data correspond to usage on the plateform after 2015. The current usage metrics is available 48-96 hours after online publication and is updated daily on week days.
Initial download of the metrics may take a while.