Fig. 2.
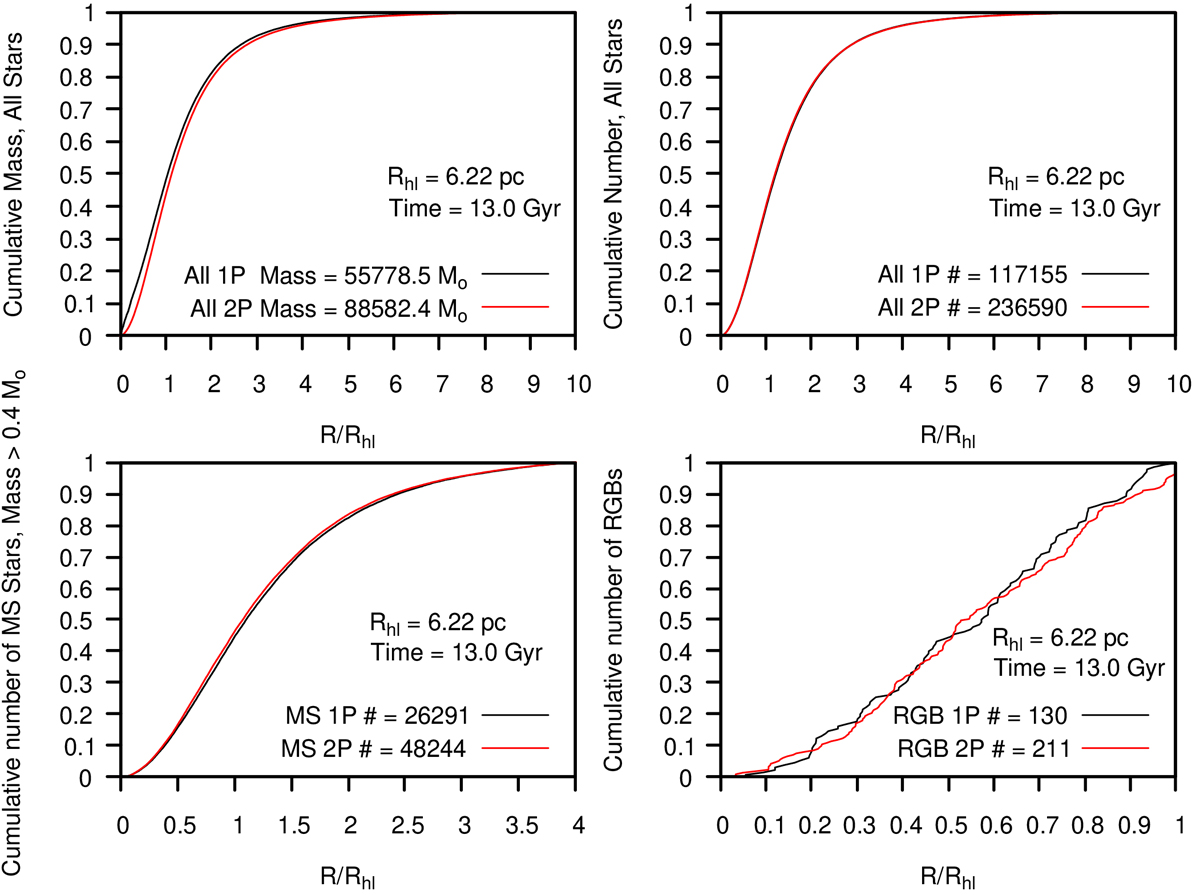
Download original image
Top left panel: Cumulative mass distributions of all stars for 1P (black line) and 2P (red line) as a function of distance scaled by Rhl in the projected (2D) snapshot at 13 Gyr. Top right panel: Cumulative number distributions of all stars for 1P (black line) and 2P (red line) as a function of distance scaled by Rhl in the snapshot at 13 Gyr. Bottom left panel: Cumulative number distributions of MS stars with masses greater than 0.4 M⊙ for 1P (black line) and 2P (red line) as a function of distance scaled by Rhl in the snapshot at 13 Gyr. Bottom right panel: Cumulative number distributions of RGB stars for 1P (black line) and 2P (red line) as a function of distance scaled by Rhl in the snapshot at 13 Gyr, shown up to a distance of Rhl.
Current usage metrics show cumulative count of Article Views (full-text article views including HTML views, PDF and ePub downloads, according to the available data) and Abstracts Views on Vision4Press platform.
Data correspond to usage on the plateform after 2015. The current usage metrics is available 48-96 hours after online publication and is updated daily on week days.
Initial download of the metrics may take a while.