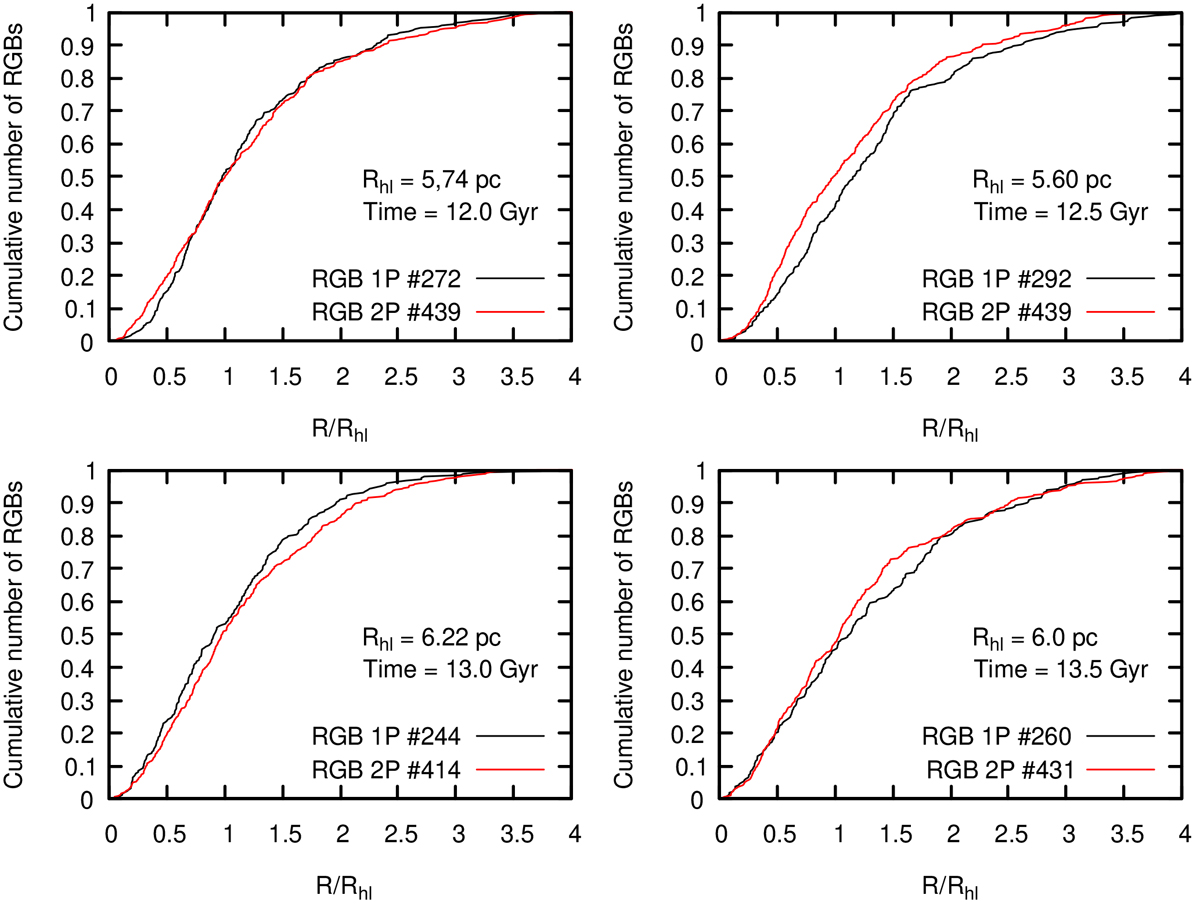
Fig. 1.
Download original image
Cumulative number distributions of RGB stars for 1P (black line) and 2P (red line) as a function of distance scaled by Rhl for selected projected (2D) snapshots from 12 Gyr to 13.5 Gyr. 1P is more centrally concentrated than 2P only in the snapshot at 13 Gyr. The number distributions of both populations change significantly over time, and the overconcentration of 1P is a transient feature. The Rhl values, snapshot times, and the number of RGB stars are provided in the insets of each panel.
Current usage metrics show cumulative count of Article Views (full-text article views including HTML views, PDF and ePub downloads, according to the available data) and Abstracts Views on Vision4Press platform.
Data correspond to usage on the plateform after 2015. The current usage metrics is available 48-96 hours after online publication and is updated daily on week days.
Initial download of the metrics may take a while.