Fig. 4.
Download original image
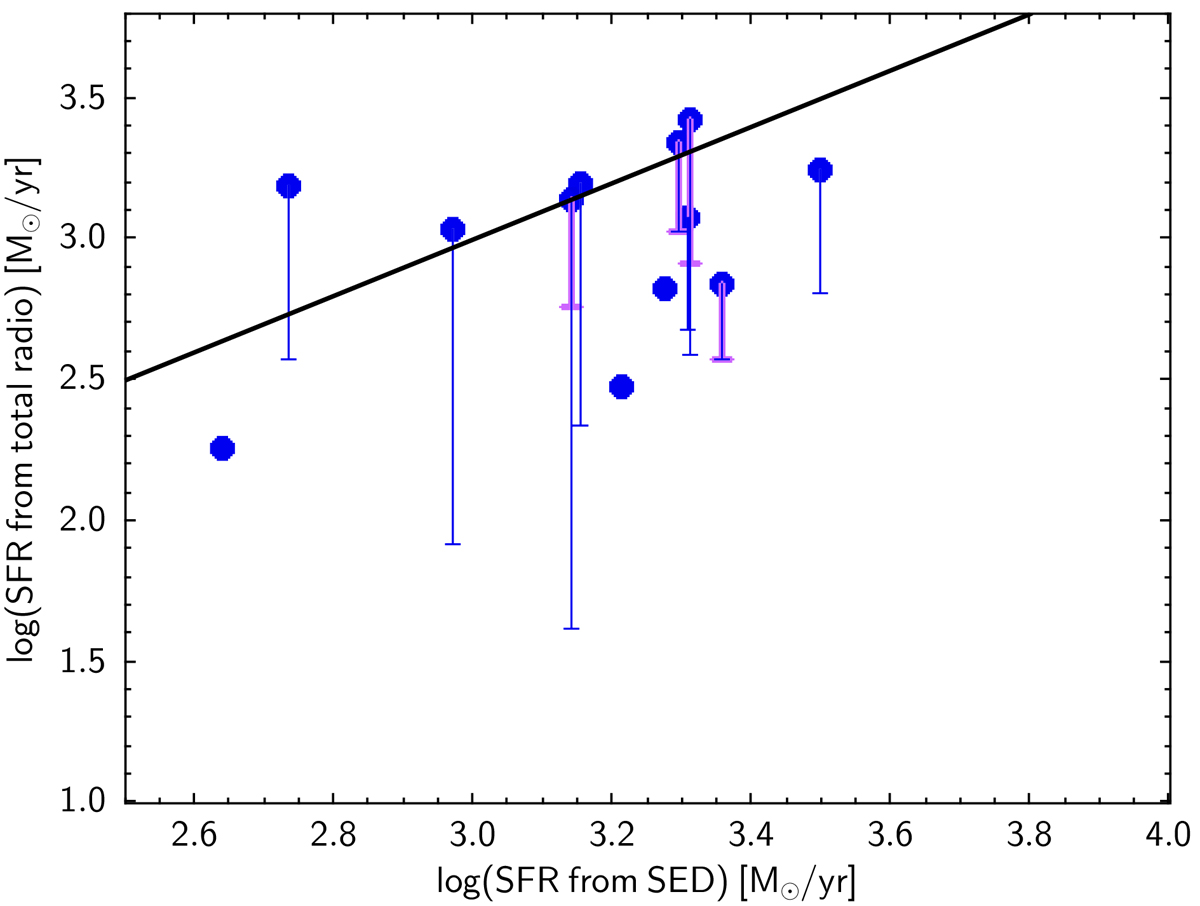
SFR derived using the total radio flux measured at 6″ resolution versus the SFR derived from SED fitting. The blue points have been derived using Eq. (3). The purple error bars show the SFRs when only the contribution from radio components on scales <6″ is subtracted (SMM IDs 3a, 12a, 47a, and 55a), and the blue error bars show the SFRs when the radio AGN contribution is subtracted as well (SMM IDs 15, 16, 24, 29, 47a, 55a, and 77). For SMGs 47a and 55a, the blue error bars take the sum of the two contributions into account. The black line is the 1:1 line where the SFRs derived from the two methods are equal.
Current usage metrics show cumulative count of Article Views (full-text article views including HTML views, PDF and ePub downloads, according to the available data) and Abstracts Views on Vision4Press platform.
Data correspond to usage on the plateform after 2015. The current usage metrics is available 48-96 hours after online publication and is updated daily on week days.
Initial download of the metrics may take a while.