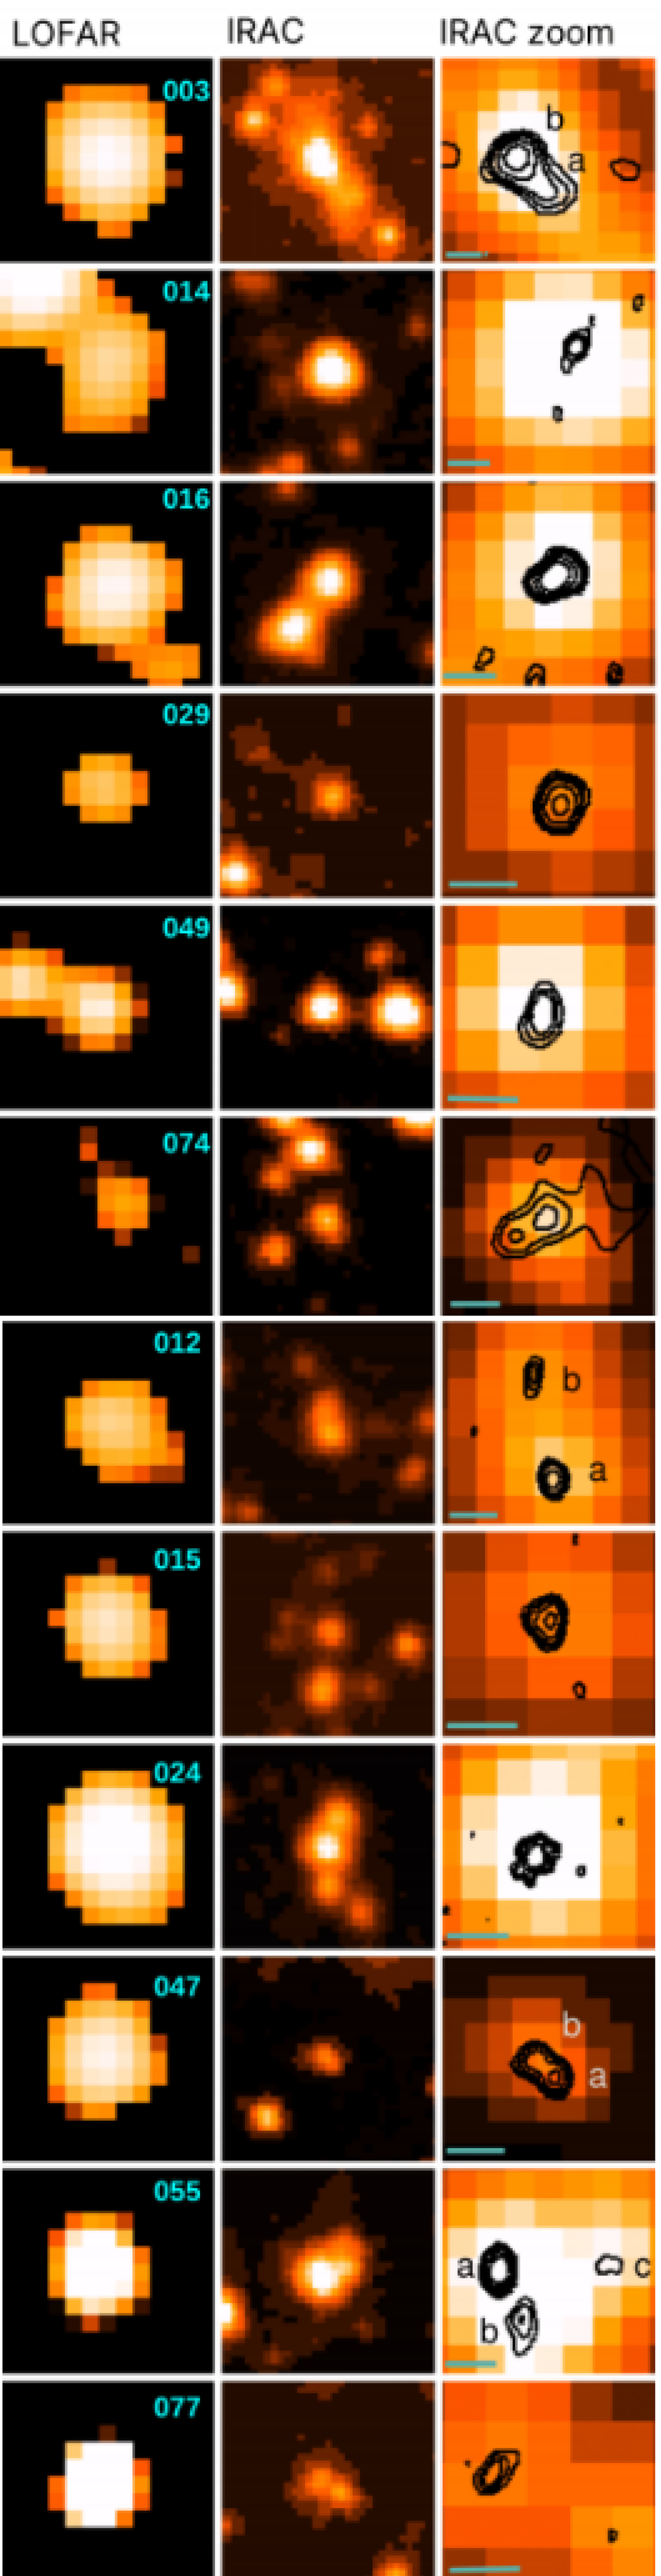
Fig. 2.
Download original image
Images of the 12 bright SMGs. For each galaxy (the SMM ID is displayed in the top-right corner of the left panel) the left and middle panels display the LOFAR 6″ and the IRAC 4.5 μm image, respectively. The two images show the same 20″×20″ region centred at the position of the SMG. The right panel is a zoomed-in sub-region of the IRAC image with the 144 MHz ILT radio contours drawn in black. The sizes of the zoomed-in sub-regions are in the range 2.5″−6″, and the length of the cyan ruler in the lower-left corner of the IRAC zoomed-in images is 1″. The letters (a, b, and c) refer to the different galaxies or components listed in Table 2. Radio contours are drawn at 3, 4, 5, 7, and 10×σ, where σ is the local radio rms noise.
Current usage metrics show cumulative count of Article Views (full-text article views including HTML views, PDF and ePub downloads, according to the available data) and Abstracts Views on Vision4Press platform.
Data correspond to usage on the plateform after 2015. The current usage metrics is available 48-96 hours after online publication and is updated daily on week days.
Initial download of the metrics may take a while.