Fig. 6
Download original image
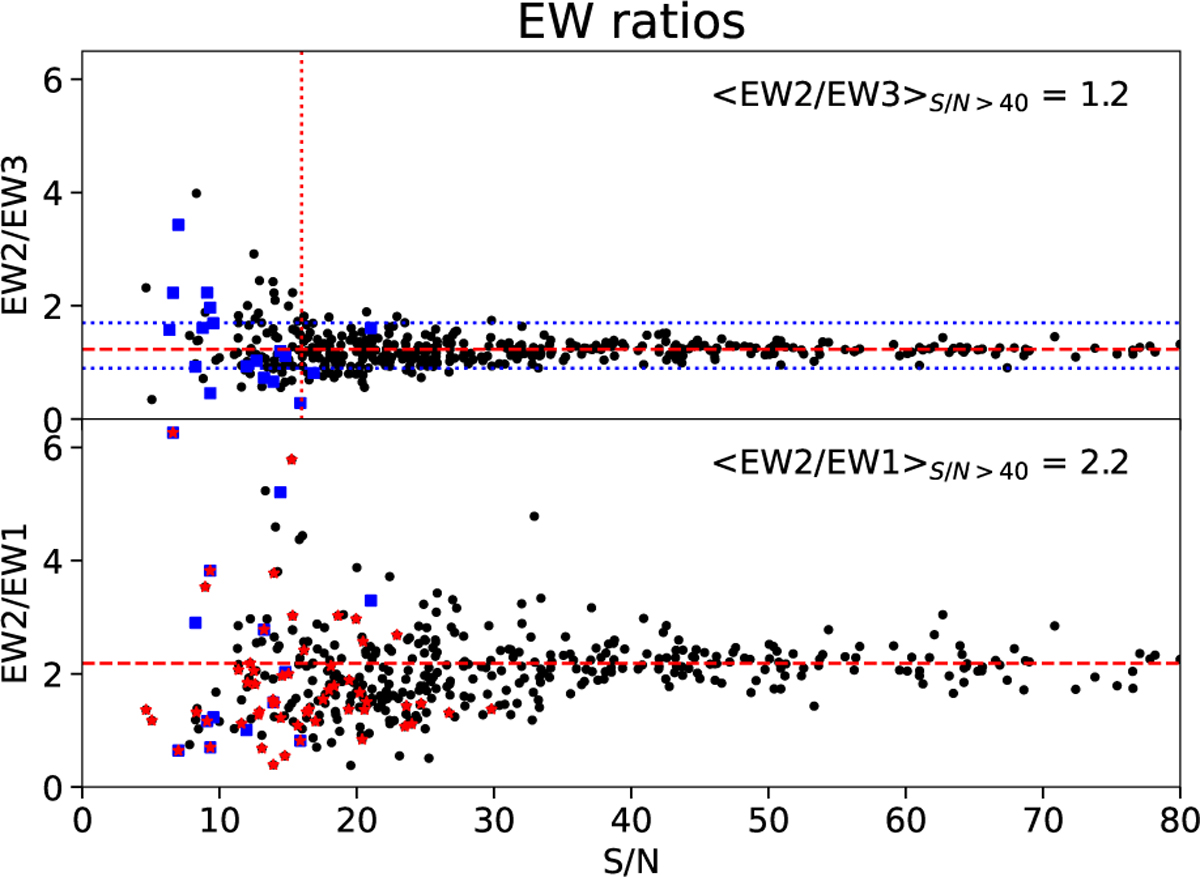
Ratios of the EWs of the Ca II Triplet lines EW3 and EW1 with respect to the strongest line, EW2, as function of the S/N per pixel for individual VLT/FLAMES LR8 spectra that are likely members of the Sextans dSph with G < 19.7. Blue squares are spectra that do not meet the vdiff criterion. The vertical dotted red line in the upper panel is at S/N = 16 per pixel, which is the cut for accurate [Fe/H] measurements based on EW2/EW3. The horizontal dotted blue lines are limits of the values of the ratios at 0.9 < EW2/EW3 < 1.7. In the lower plot, red star symbols do not meet the limits in the upper plot for EW2/EW3. The dashed horizontal red lines in both panels show the mean of the ratios at a S/N > 40 per pixel.
Current usage metrics show cumulative count of Article Views (full-text article views including HTML views, PDF and ePub downloads, according to the available data) and Abstracts Views on Vision4Press platform.
Data correspond to usage on the plateform after 2015. The current usage metrics is available 48-96 hours after online publication and is updated daily on week days.
Initial download of the metrics may take a while.