Fig. 9
Download original image
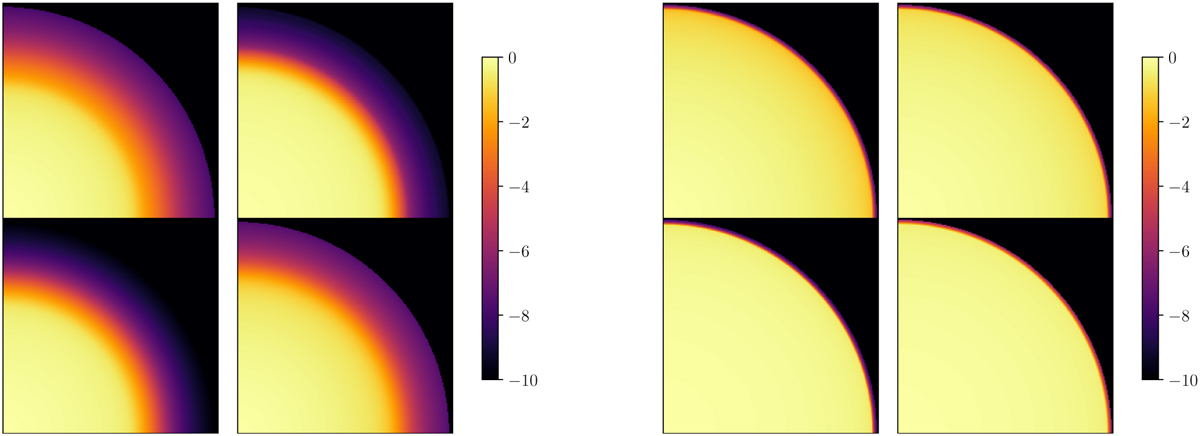
Visualizations of the center-to-limb variation of a model with Teff = 3000 K, log(g) = 0.0 (left panels, 1.35 M⊙) and log(g) = 5.0 (right panels, 0.27 M⊙), solar abundances for 4 wavelengths: 2775 Å (top left), 6500 Å (top right), 9000 Å (bottom left), and 1.49 μm (bottom right). The colors indicated by the color bar give log10(I/I(μ = 1)).
Current usage metrics show cumulative count of Article Views (full-text article views including HTML views, PDF and ePub downloads, according to the available data) and Abstracts Views on Vision4Press platform.
Data correspond to usage on the plateform after 2015. The current usage metrics is available 48-96 hours after online publication and is updated daily on week days.
Initial download of the metrics may take a while.