Fig. 9
Download original image
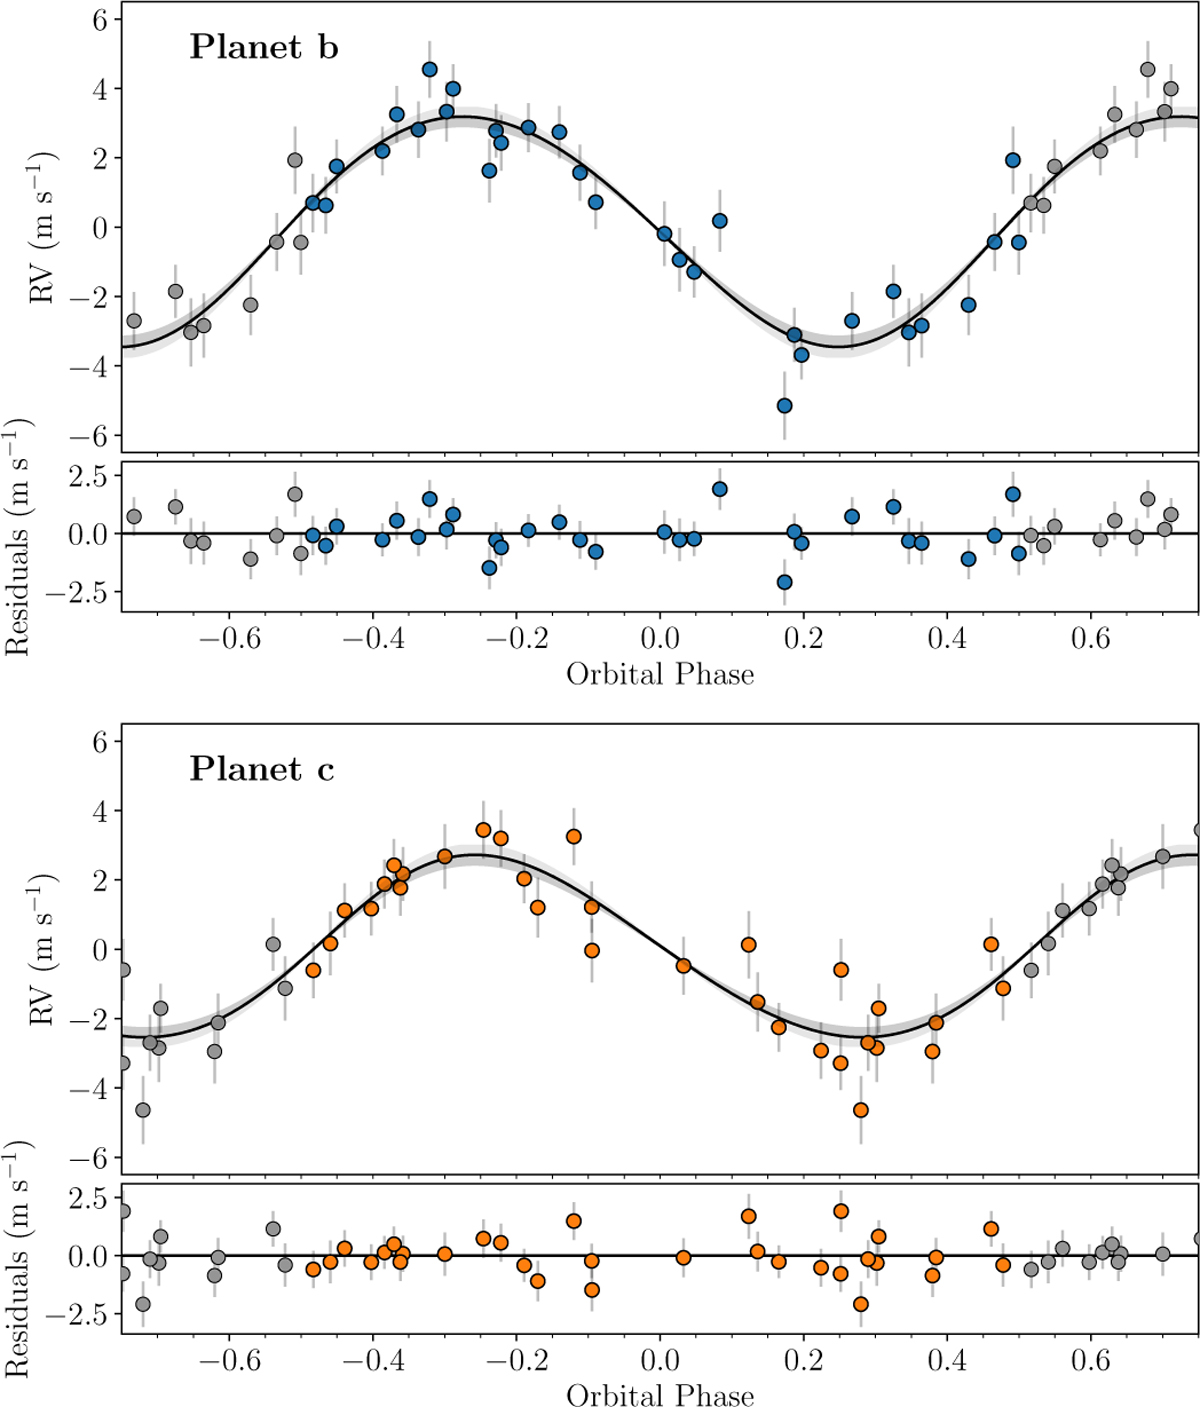
Phase-folded RVs of TOI-771 b and c and global RV model from the joint analysis. In the phase-folded plots, the coloured points shows the ESPRESSO data (with over-phased points in grey), and the solid black line shows the best-fitting model, with the ±1σ region displayed as a shaded area. Residuals are shown in the bottom panel. The jitter term has been added in quadrature to each error bar.
Current usage metrics show cumulative count of Article Views (full-text article views including HTML views, PDF and ePub downloads, according to the available data) and Abstracts Views on Vision4Press platform.
Data correspond to usage on the plateform after 2015. The current usage metrics is available 48-96 hours after online publication and is updated daily on week days.
Initial download of the metrics may take a while.