Fig. 5
Download original image
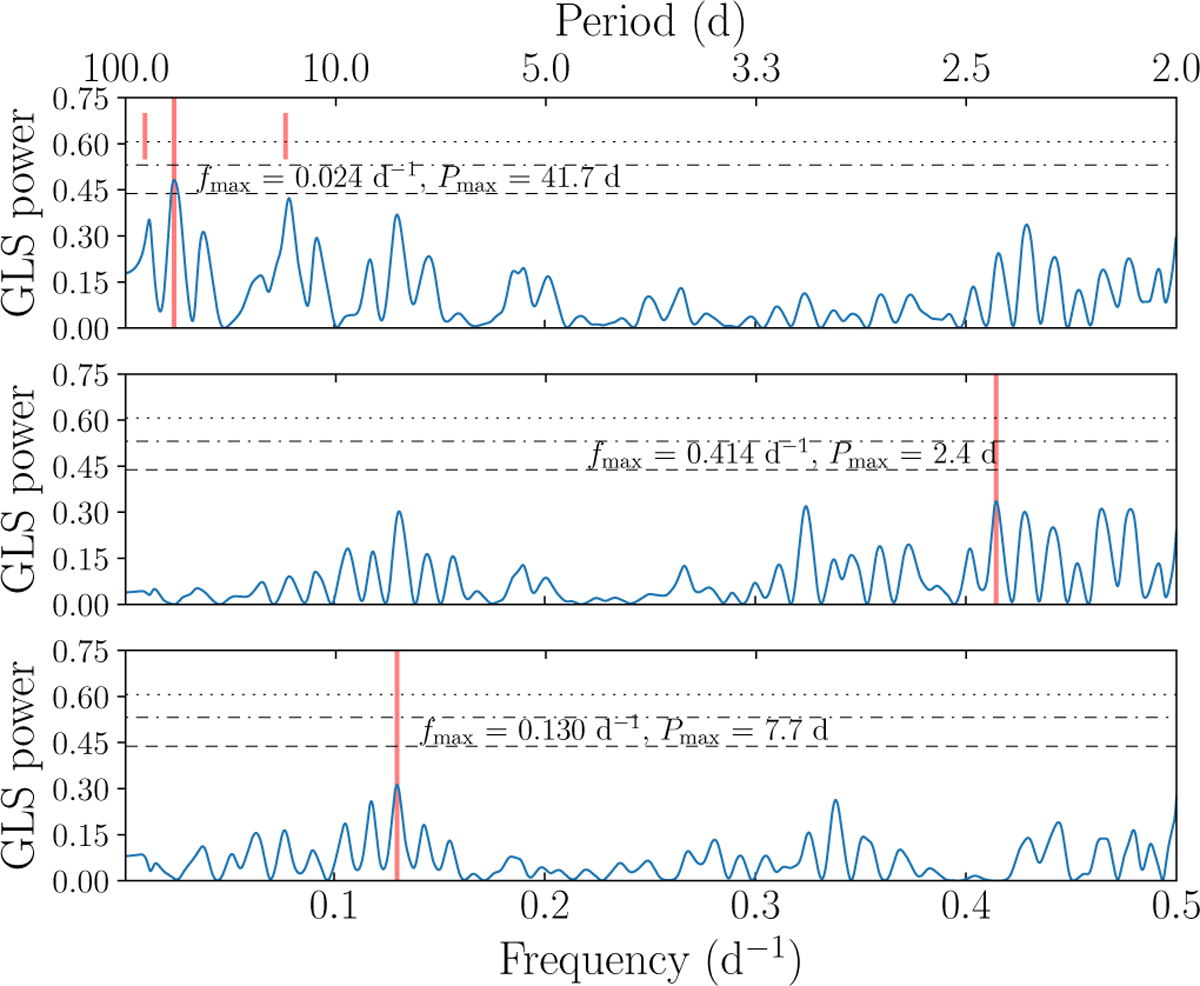
Iterative GLS periodogram of the TOI-771 ESPRESSO RVs. The sinusoidal model corresponding to the best frequency is subtracted at each iteration, starting from top to bottom. The vertical red line marks most significant peak in each iteration, and the corresponding frequency and period are reported. The vertical red ticks in the first panel mark the peaks at ∼98 d and ∼13 d, which are related to each other and to the 42-d signal. All three peaks disappear after the first iteration. The 10%, 1%, and 0.1% FAP levels are drawn with horizontal dashed, dashdotted, and dotted lines, respectively.
Current usage metrics show cumulative count of Article Views (full-text article views including HTML views, PDF and ePub downloads, according to the available data) and Abstracts Views on Vision4Press platform.
Data correspond to usage on the plateform after 2015. The current usage metrics is available 48-96 hours after online publication and is updated daily on week days.
Initial download of the metrics may take a while.