Fig. 2
Download original image
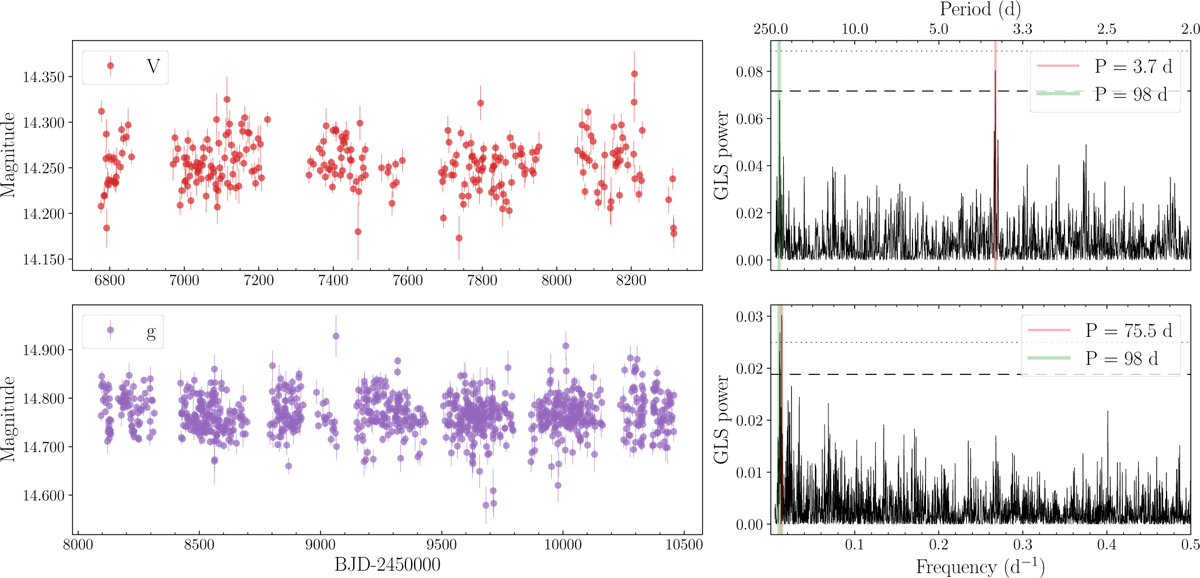
ASAS-SN V - and g photometry of TOI-771. The GLS periodogram of each light curve is shown in the right panel, with the 10% and 1% false alarm probability (FAP) levels marked with an horizontal dashed and dotted line, respectively. The vertical red line highlights the most significant peak, while the vertical green line shows the periodicity at ∼ 98 d.
Current usage metrics show cumulative count of Article Views (full-text article views including HTML views, PDF and ePub downloads, according to the available data) and Abstracts Views on Vision4Press platform.
Data correspond to usage on the plateform after 2015. The current usage metrics is available 48-96 hours after online publication and is updated daily on week days.
Initial download of the metrics may take a while.