Fig. 15
Download original image
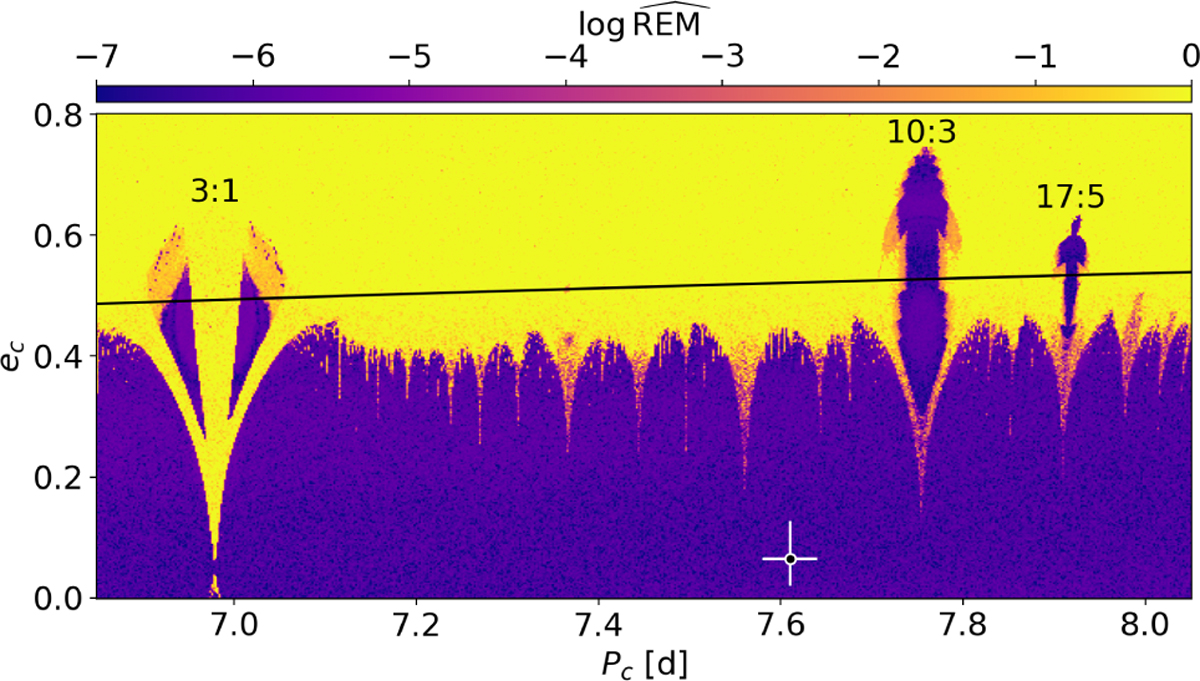
REM dynamical map for the solution presented in Table 4 in the (Pc,ec) plane of planet c. Small values of log ![]() characterise regular (long-term stable) solutions, marked with a dark blue colour. Dynamically chaotic solutions are marked with lighter colours, up to yellow. Some of the MMRs producing dynamical features in the map are highlighted. The black curve represents the geometric collision of the orbits, defined by the condition: ab(1 + eb) = ac (1 − ec). The white circle with crossed lines shows our best-fit solution with uncertainties. The resolution of the map is 601×301 points.
characterise regular (long-term stable) solutions, marked with a dark blue colour. Dynamically chaotic solutions are marked with lighter colours, up to yellow. Some of the MMRs producing dynamical features in the map are highlighted. The black curve represents the geometric collision of the orbits, defined by the condition: ab(1 + eb) = ac (1 − ec). The white circle with crossed lines shows our best-fit solution with uncertainties. The resolution of the map is 601×301 points.
Current usage metrics show cumulative count of Article Views (full-text article views including HTML views, PDF and ePub downloads, according to the available data) and Abstracts Views on Vision4Press platform.
Data correspond to usage on the plateform after 2015. The current usage metrics is available 48-96 hours after online publication and is updated daily on week days.
Initial download of the metrics may take a while.