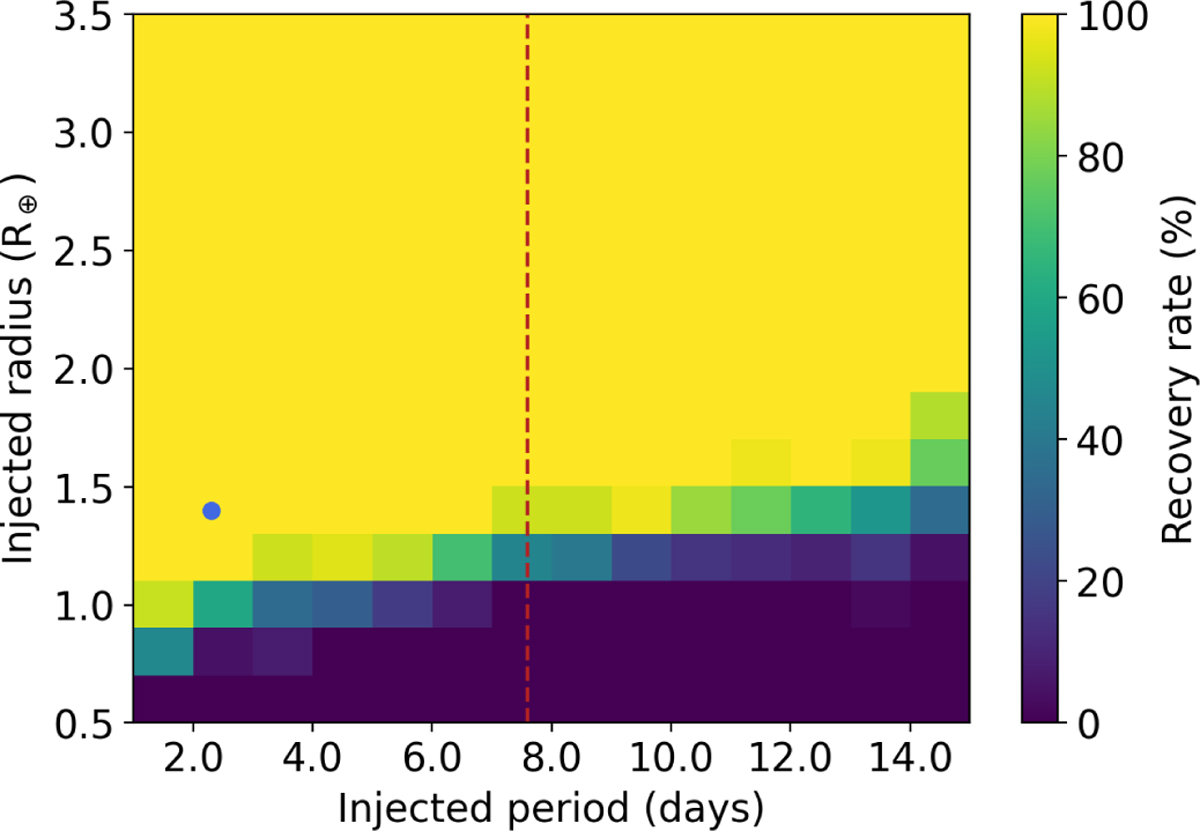
Fig. 11

Download original image
Detectability map of TOI-771. The injection-and-recovery experiment was conducted to establish the detection limits using the TESS data. The blue dot marks the position of TOI-771 b, while the dotted red line indicates the 7.6 d period of TOI-771 c as inferred from the RV fit. We explored 9000 different scenarios, where each pixel evaluates ∼45 of them. Larger recovery rates are presented in yellow and green colours, while lower recovery rates are shown in blue and darker hues.
Current usage metrics show cumulative count of Article Views (full-text article views including HTML views, PDF and ePub downloads, according to the available data) and Abstracts Views on Vision4Press platform.
Data correspond to usage on the plateform after 2015. The current usage metrics is available 48-96 hours after online publication and is updated daily on week days.
Initial download of the metrics may take a while.


