Fig. 10
Download original image
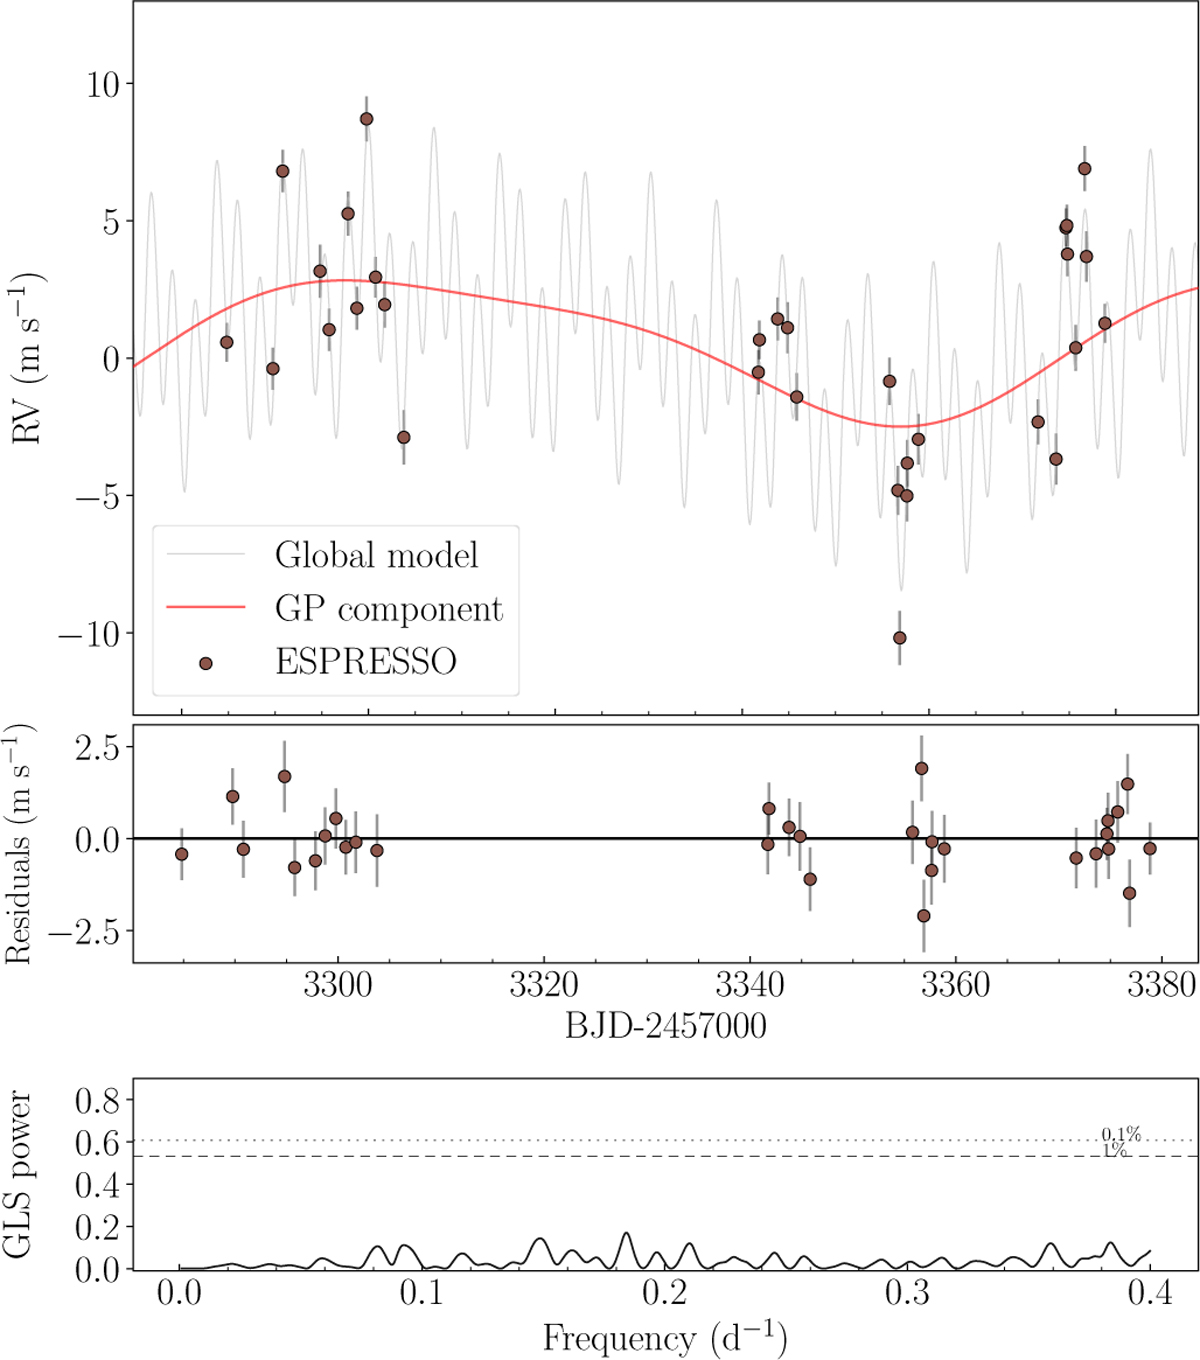
TOI-771 RV model from the joint fit. The solid grey line shows the best-fit global model, while the solid red line refers to GP component. Residuals are shown in the central panel. The jitter term has been added in quadrature to each error bar. The GLS periodogram of the residuals is shown in the bottom panel. The 1% and 0.1% FAP levels are marked with a horizontal dashed and dotted line, respectively. No significant signals are identified in the periodogram.
Current usage metrics show cumulative count of Article Views (full-text article views including HTML views, PDF and ePub downloads, according to the available data) and Abstracts Views on Vision4Press platform.
Data correspond to usage on the plateform after 2015. The current usage metrics is available 48-96 hours after online publication and is updated daily on week days.
Initial download of the metrics may take a while.