Fig. 5
Download original image
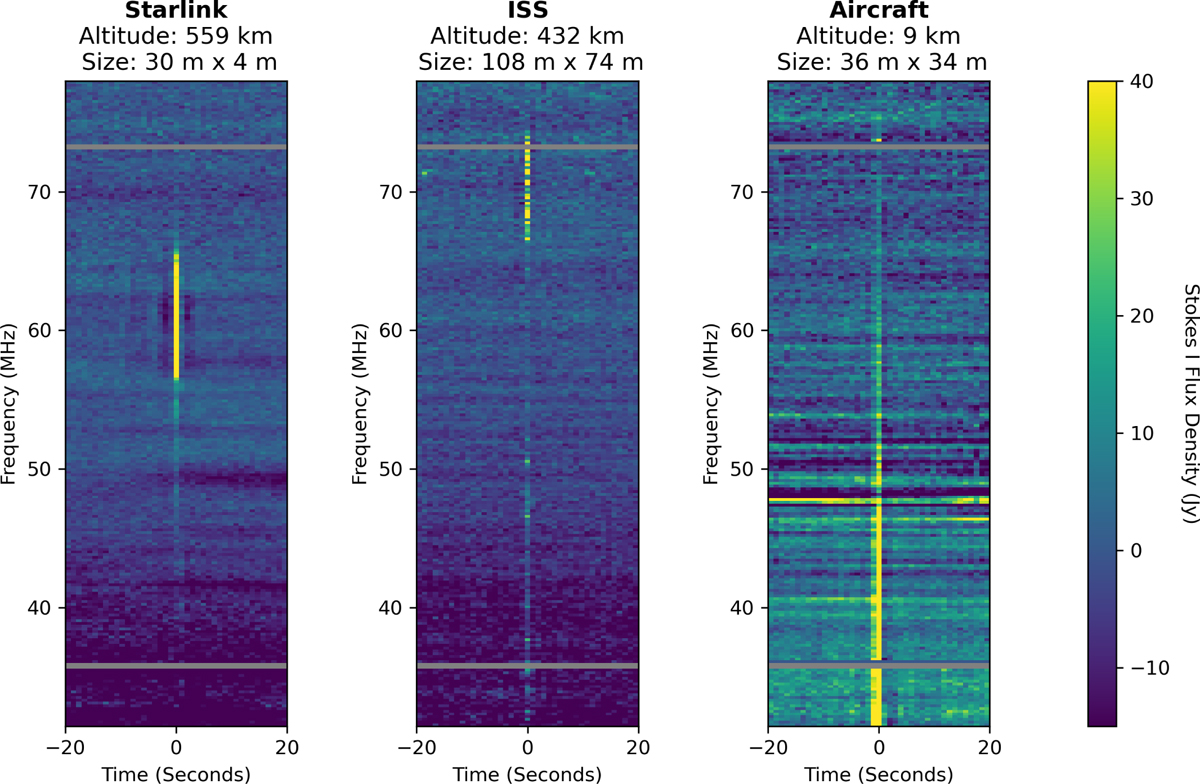
Dynamic spectra of three objects observed with NenuFAR: STARLINK-31097, the International Space Station (ISS), and an Airbus A319 aircraft. The x-axis represents time, with 0 seconds corresponding to the time of the target detection. The altitudes of the objects, determined at the time of detection, and their sizes (length times width) are listed in each panel. The noise level in the aircraft panel is higher than in the other two panels because the aircraft observation occurred during the daytime, while the Starlink and ISS observations were made at night. The gray shaded regions in each panel indicate frequency channels that are known to be contaminated by RFI. These were masked during the analysis.
Current usage metrics show cumulative count of Article Views (full-text article views including HTML views, PDF and ePub downloads, according to the available data) and Abstracts Views on Vision4Press platform.
Data correspond to usage on the plateform after 2015. The current usage metrics is available 48-96 hours after online publication and is updated daily on week days.
Initial download of the metrics may take a while.