Fig. 4
Download original image
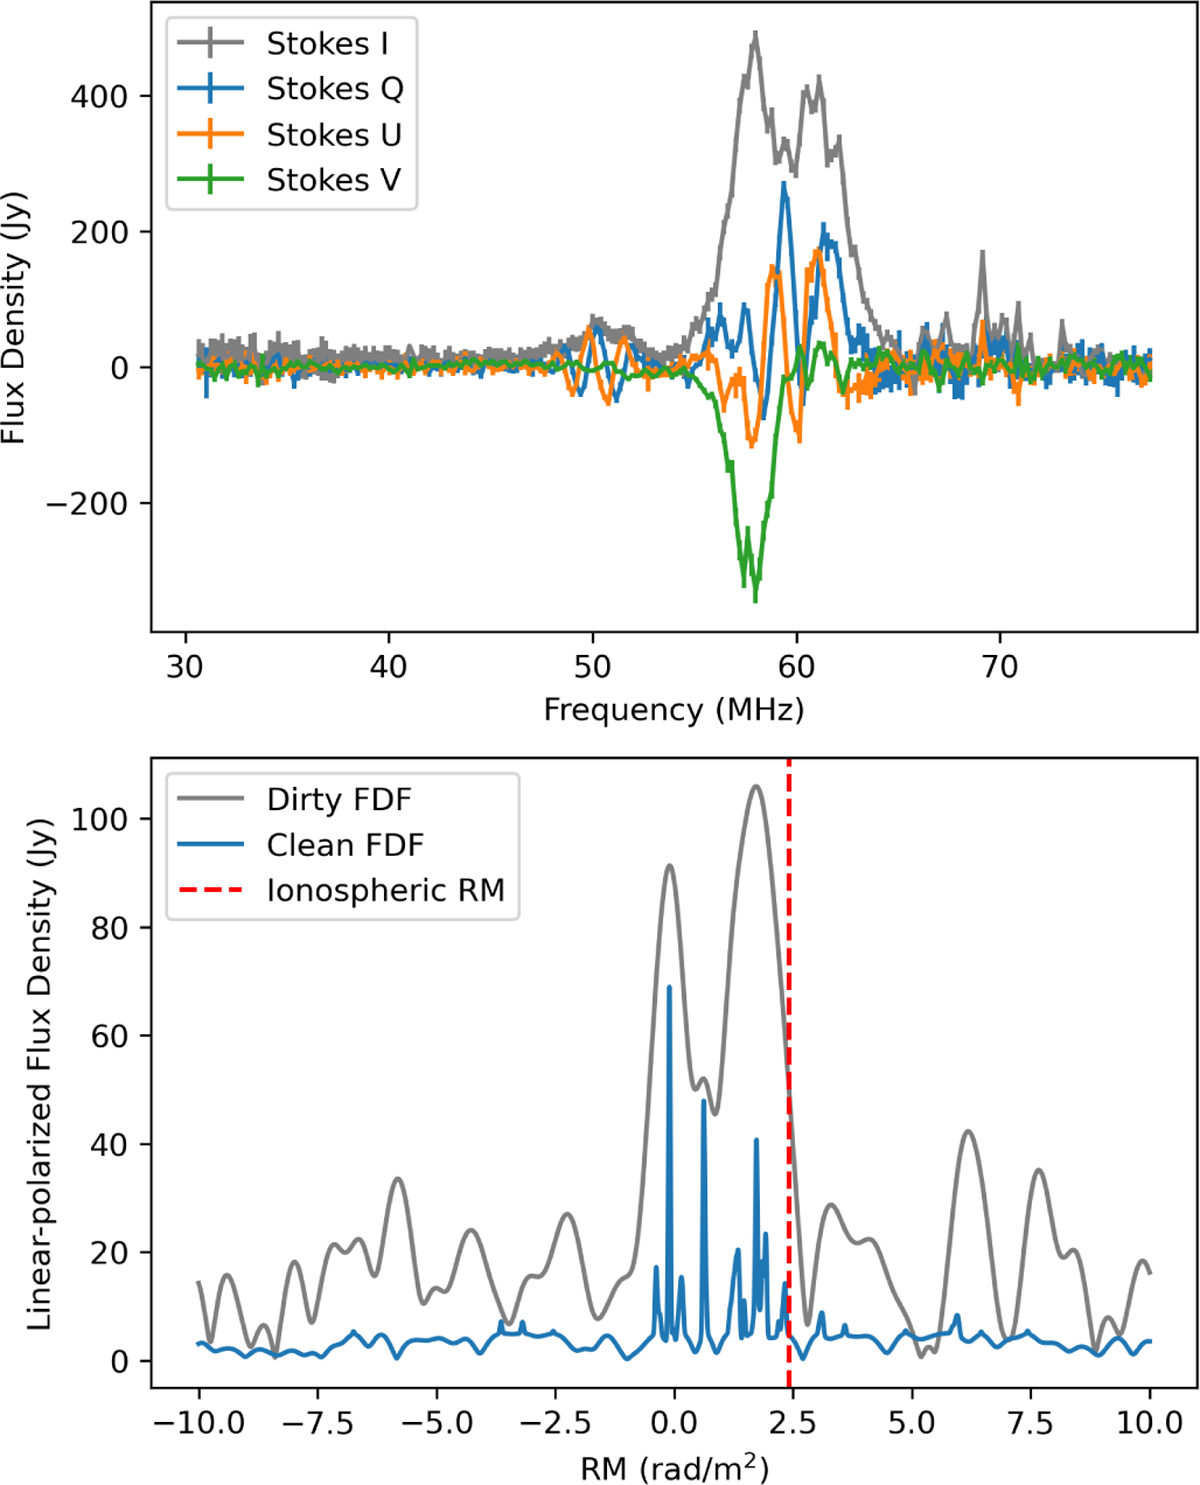
Polarized spectra for STARLINK-31034, obtained from a single beam near the center of the FoV. The top panel displays the Stokes IQUV spectra of the satellite, and the bottom panel shows the result of the RM synthesis on the linear polarization. The vertical red line in the bottom panel indicates the ionospheric RM at the time the IQUV spectra were collected, as estimated using GPS data.
Current usage metrics show cumulative count of Article Views (full-text article views including HTML views, PDF and ePub downloads, according to the available data) and Abstracts Views on Vision4Press platform.
Data correspond to usage on the plateform after 2015. The current usage metrics is available 48-96 hours after online publication and is updated daily on week days.
Initial download of the metrics may take a while.