Fig. 2
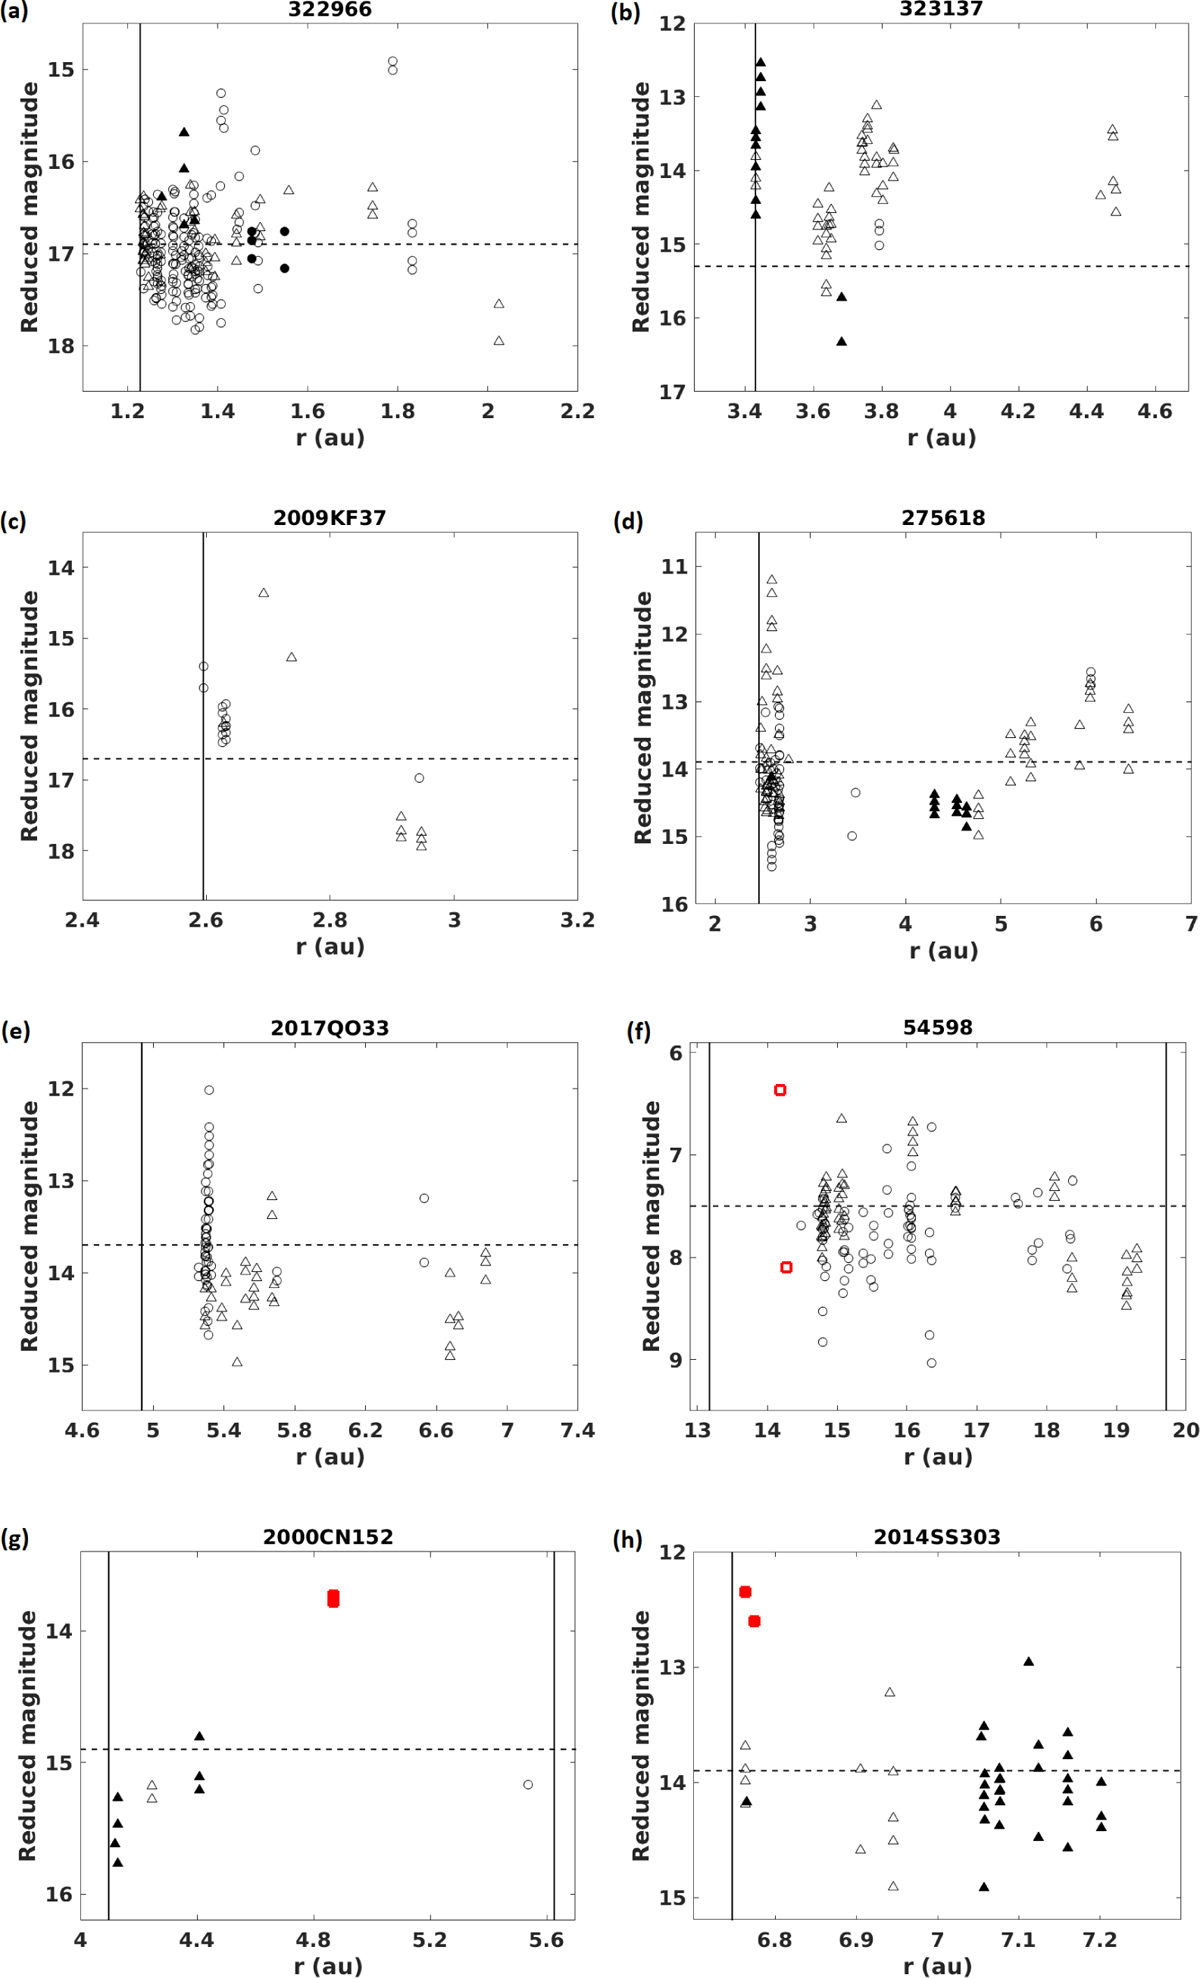
Download original image
Reduced magnitude of (a) 322966, (b) 323173, (c) 2009 KF37, (d) 275618, (e) 2017 QO33, (f) 54598, (g) 2000 CN152, and (h) 2014 SS303. The vertical line on the left indicates the perihelion distance of the object. In some cases, a vertical line is also plotted to the right, indicating the aphelion distance. The dotted horizontal line shows the MPC catalog absolute magnitude, which it is taken as a reference. The empty symbols correspond to observations made before passing through perihelion (f > 180°), and filled symbols correspond to observations after perihelion passage (f < 180°). The data plotted with triangles correspond to large surveys, black circles correspond to any other MPC data, and red squares show the data obtained in this work. The scales are different for each image because they are adjusted to the data values of each object.
Current usage metrics show cumulative count of Article Views (full-text article views including HTML views, PDF and ePub downloads, according to the available data) and Abstracts Views on Vision4Press platform.
Data correspond to usage on the plateform after 2015. The current usage metrics is available 48-96 hours after online publication and is updated daily on week days.
Initial download of the metrics may take a while.