Fig. 1
Download original image
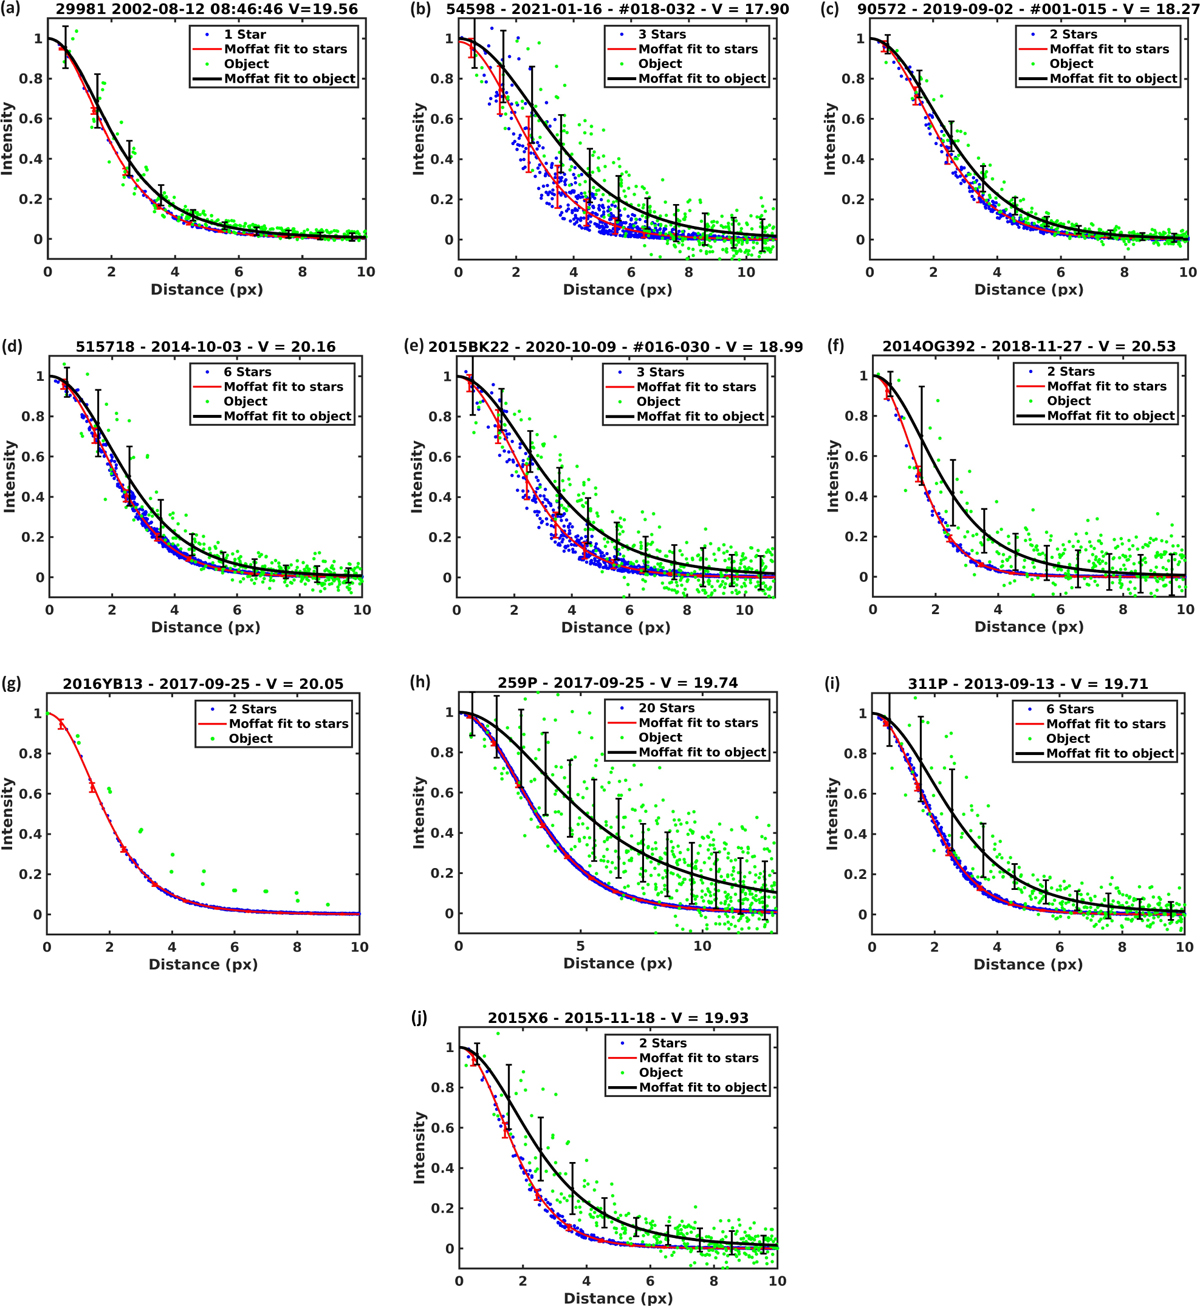
Surface brightness profiles of (a) 29981 (VLT), (b) 54598 (IMPACTON), (c) 90572 (IMPACTON), (d) 515718 (DES), (e) 2015 BK22 (IMPACTON), (f) 2014 OG392 (DES), (g) 2016 YB13 (DES), (h) 259 P (DES), (i) 311 P (DES), and (j) P/2015 X6 (DES). The plots show the normalized intensity values of each pixel from the centroid for one or more stars (blue dots), the Moffat fit of the stars (red line), the normalized intensity values of the object (green dots), and the Moffat fit of the object (black line). The red error bars correspond to the stars and the black error bars to the object. The errors were calculated from the dispersion of the flux values with respect to the fit. A small artificial horizontal offset has been introduced in the position of the bars to avoid overlap. In the image header we list the object name, date, image range (when a set of images was coadded), image number or time, and the calculated magnitude. When the object appeared as a trail (2016 YB13), the intensity values of the trail are plotted superimposed with the profile of the stars (with their Moffat fit).
Current usage metrics show cumulative count of Article Views (full-text article views including HTML views, PDF and ePub downloads, according to the available data) and Abstracts Views on Vision4Press platform.
Data correspond to usage on the plateform after 2015. The current usage metrics is available 48-96 hours after online publication and is updated daily on week days.
Initial download of the metrics may take a while.