Fig. A.1
Download original image
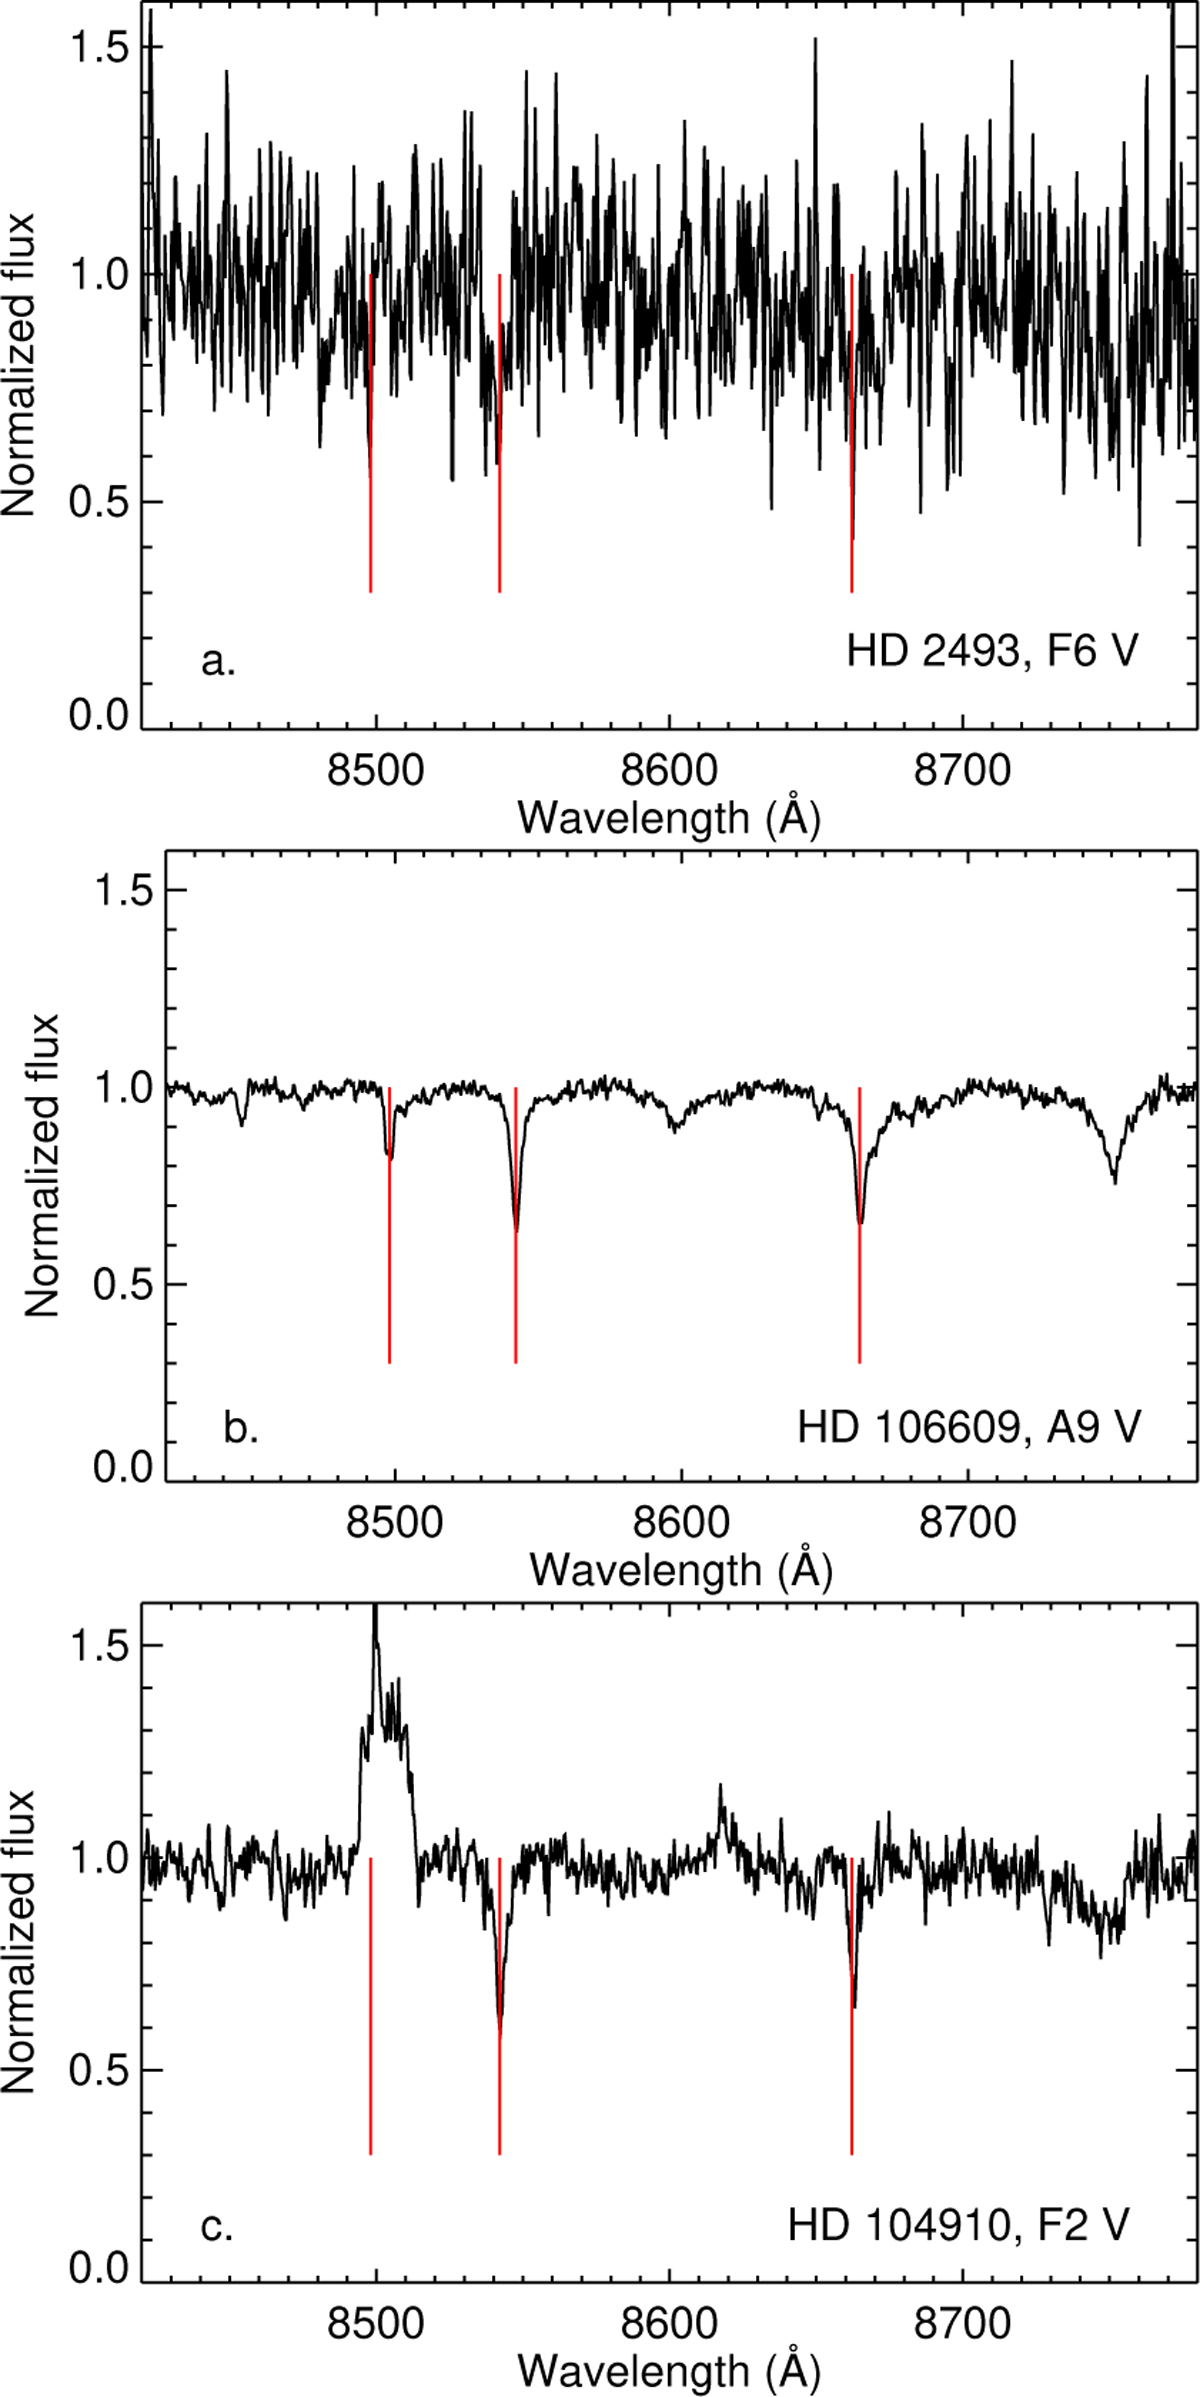
Three examples illustrating the reasons why some RAVE spectra were rejected: a) A spectrum of the F6 dwarf (Houk & Cowley 1975) HD 2493 illustrating a case of low S/N. b) A spectrum of the A9 dwarf (Houk & Smith-Moore 1988) HD 106609 illustrating contamination by Paschen lines. c) A spectrum of the F2 dwarf (Houk & Smith-Moore 1988) HD 104910 illustrating a case of odd feature seen in the spectrum. Ca II IRT lines are marked with red vertical lines.
Current usage metrics show cumulative count of Article Views (full-text article views including HTML views, PDF and ePub downloads, according to the available data) and Abstracts Views on Vision4Press platform.
Data correspond to usage on the plateform after 2015. The current usage metrics is available 48-96 hours after online publication and is updated daily on week days.
Initial download of the metrics may take a while.