Fig. 8
Download original image
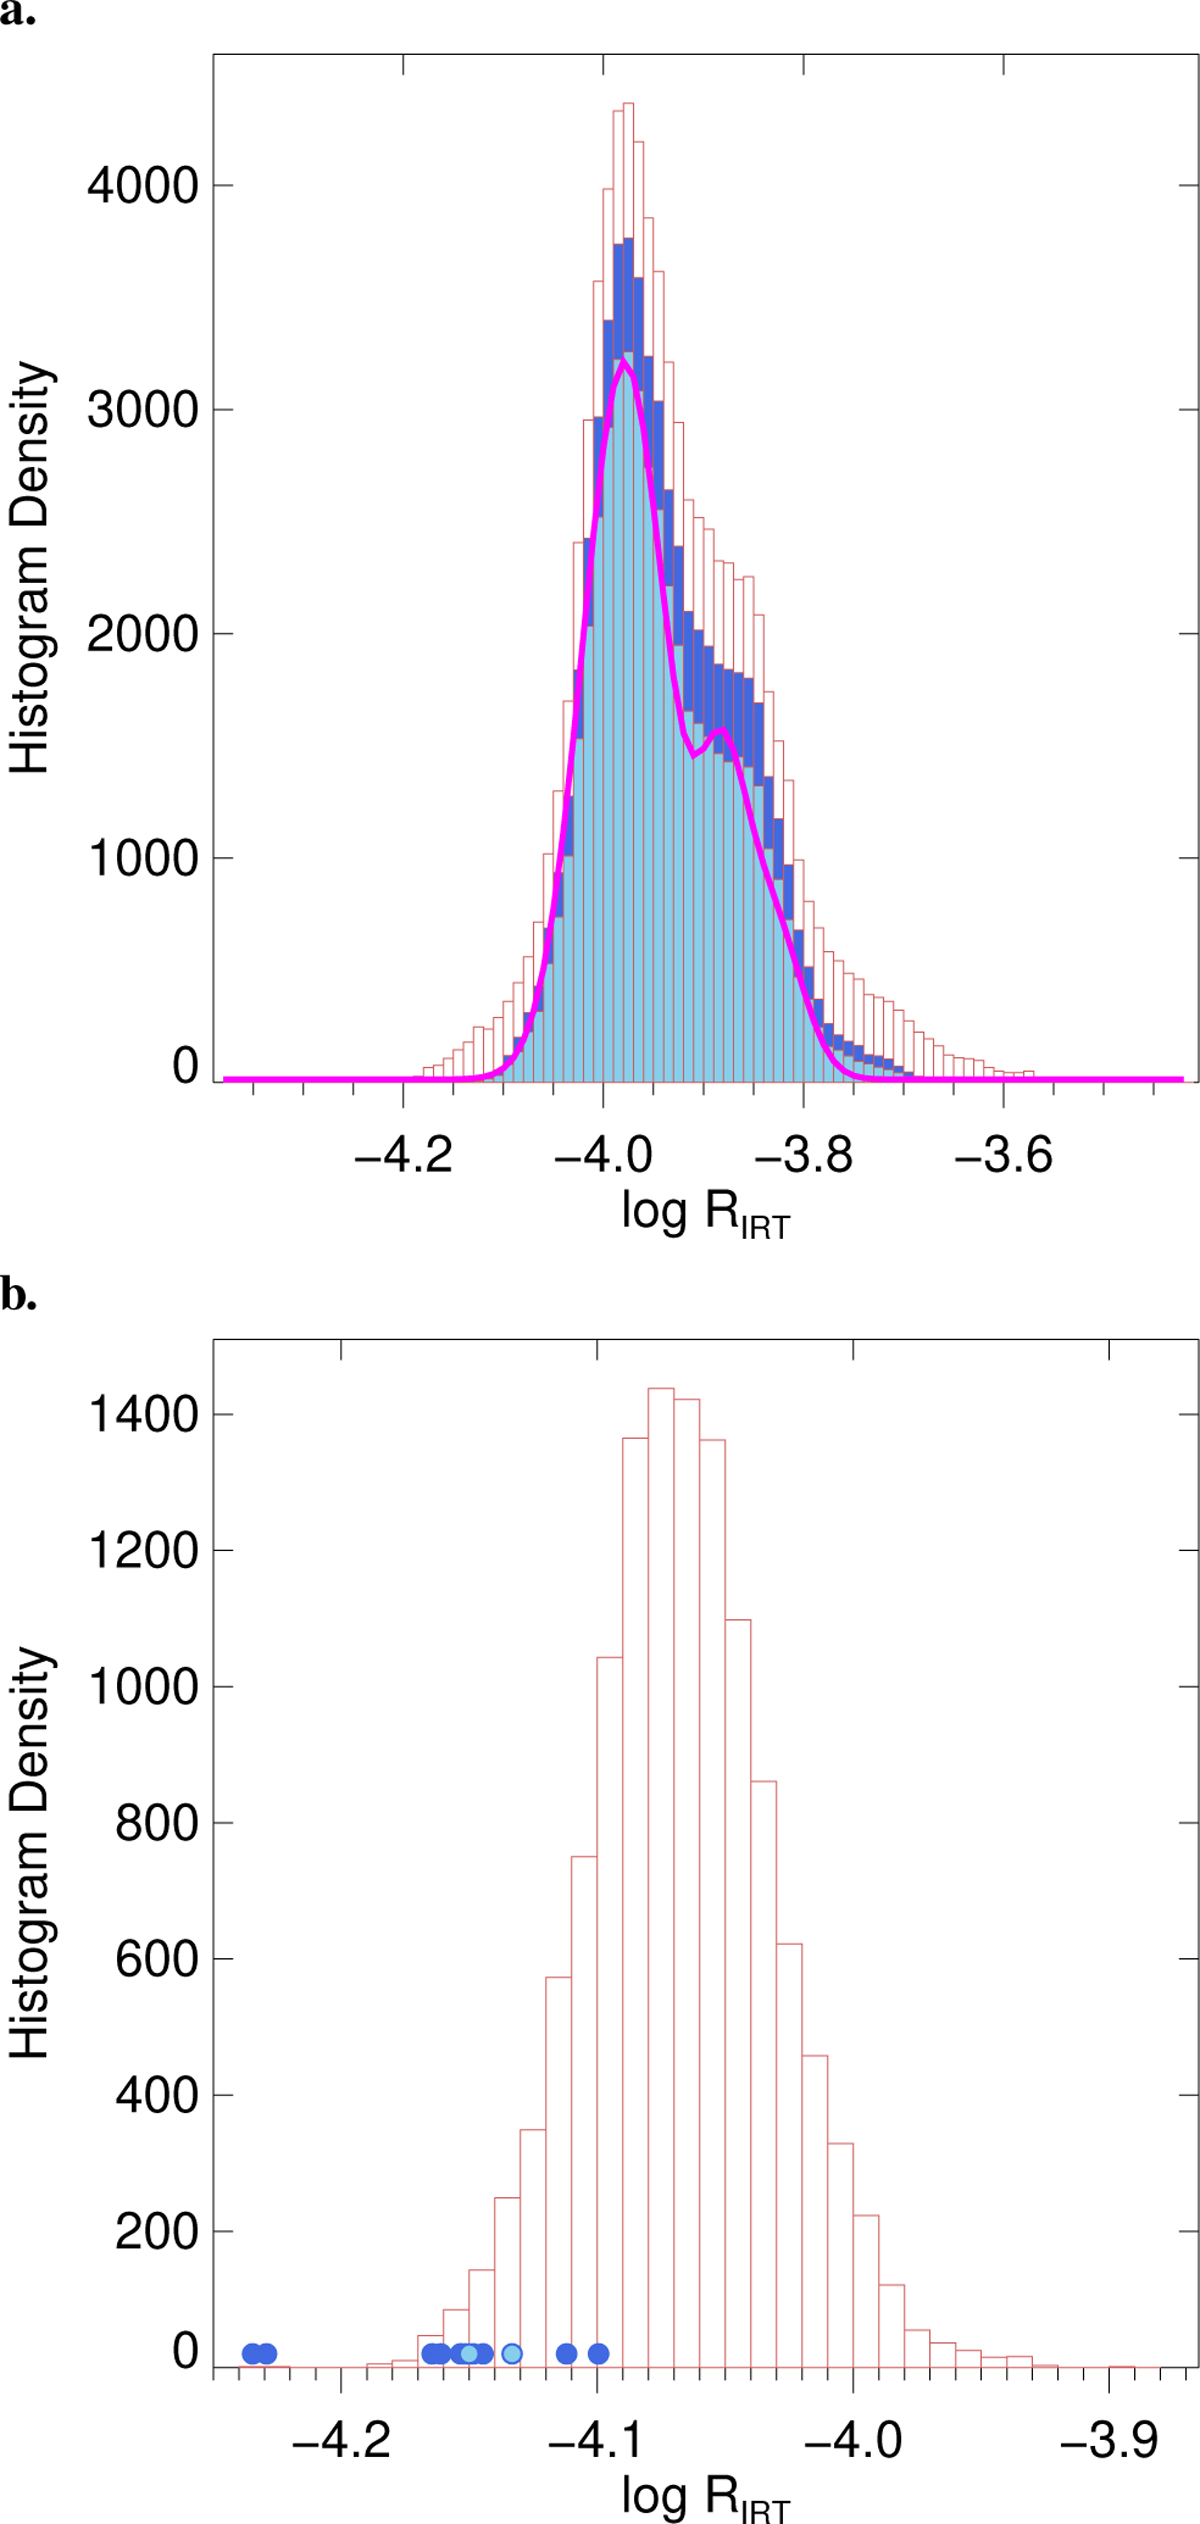
Number density versus (photospheric uncorrected) radiative loss, log RIRT, from RAVE data. a. Density distribution from the resolution-corrected but metallicity-uncorrected sample. The three colours indicate increasing average S/N. White is for the initial RAVE targets with spectra of S/N>15, dark blue is for a sample with S/N>30, and light blue for S/N>40. The magenta line is a double Gaussian fit to the sample with S/N>40. b. As above, but with metallicity correction and for B–V limited to 0.53–0.73 mag. The radiative losses of the 13 stars from Table 2 are marked with blue dots. The two MM candidates are highlighted with light blue.
Current usage metrics show cumulative count of Article Views (full-text article views including HTML views, PDF and ePub downloads, according to the available data) and Abstracts Views on Vision4Press platform.
Data correspond to usage on the plateform after 2015. The current usage metrics is available 48-96 hours after online publication and is updated daily on week days.
Initial download of the metrics may take a while.